The question no lesson asked yet
- Every model comes with knobs; Model Selection explained what they do, Cross-Validation how to compare the results honestly.
- A grid with 5 hyperparameters and 5 values each: 3,125 cross-validations, most of them in regions that were obviously bad after the first dozen.
hyperparameter optimization
treats the search itself as an optimization problem
AutoML
pushes the same idea to the whole pipeline: preprocessing, family, hyperparameters, the final ensemble
The path of this part
- Frame the searchan expensive, noisy black box; the search space
- Grid or randomBergstra & Bengio, measured
- A search that learnsa surrogate and the expected improvement
- Stop bad trials earlysuccessive halving and its budget unit
- Check what it deliversleaks and a flattering score
One call to the black box
\(\lambda\): a configuration. \(f(\lambda)\): its cross-validated score. Tuning = find the \(\lambda\) with the largest \(f(\lambda)\).
- kc1: 2,109 software modules of a NASA flight system, 21 code metrics; target: was a defect found later? (15.5% defective)
- One call = the area under the ROC curve (ROC AUC) of a boosted model, averaged over a 5-fold cross-validation (CV).
Expensive, noisy, and a black box
| settings | 5 fold shuffles | mean |
|---|---|---|
| defaults | 0.760 · 0.776 · 0.767 · 0.769 · 0.769 | 0.768 |
| small, slow trees | 0.795 · 0.806 · 0.804 · 0.803 · 0.805 | 0.803 |
expensive
each call is 5 fits; on a real project, minutes or hours. The number of calls is the budget.
noisy
0.760 to 0.776 for the same settings: a difference of 0.01 may not be real
black box
no gradient with respect to min_samples_leaf; integers, categories, conditional knobs
Designing the space (1): the scale
| learning rate in | uniform | log-uniform |
|---|---|---|
| [0.001, 0.01) | 0.9% | 33.5% |
| [0.01, 0.1) | 9.1% | 33.2% |
| [0.1, 1) | 90.0% | 33.3% |
By hand: \(0.009 / 0.999 = 0.9\%\); on the log scale each of the 3 decades gets a third.
C, alpha, numbers of leaves or neighbors) gets a log scale: loguniform, or log=True in Optuna.Designing the space (2): conditional knobs
Cbelongs to the logistic regression,max_leaf_nodesto the booster,gammato an RBF (radial basis function) kernel.- One grid over all of them would pair every
Cwith every tree size: the same logistic regression, fitted again and again.
if.Grid or random? The argument
- A score that depends on one hyperparameter \(x_1\) (a bump of width 0.05); the other \(d - 1\) do nothing.
- A grid with \(k\) values per axis costs \(k^d\) evaluations, but tries \(x_1\) at only \(k\) values.
- Random search with budget \(B\) tries \(x_1\) at \(B\) values, whatever \(d\) is.
Grid or random? Measured on 4,000 problems
| d | budget | grid | random |
|---|---|---|---|
| 2 | 9 | 0.378 | 0.629 |
| 2 | 81 | 0.824 | 0.985 |
| 3 | 27 | 0.378 | 0.900 |
| 4 | 81 | 0.378 | 0.986 |
| 4 | 256 | 0.501 | 0.998 |
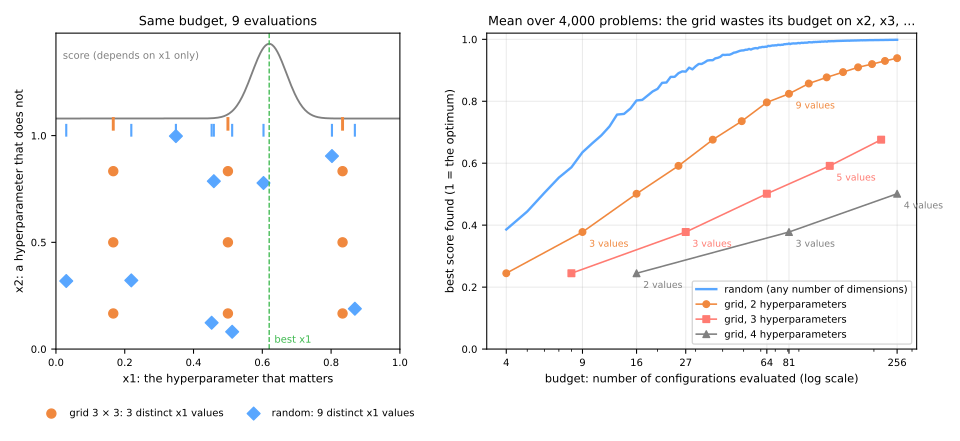
Mean best score. The grid pays for every irrelevant axis with a multiplication of its cost; random search pays nothing (Bergstra & Bengio, 2012).
Simulator: same budget, different searches
Predict. Budget 81: how many distinct values of \(x_1\) does the 9 × 9 grid try, and how many does random search try?
Bayesian optimization: a search that learns
Random search draws the 27th configuration exactly like the first. When each evaluation costs an hour, that is wasteful.
- fit a cheap surrogate to the (configuration, score) pairs so far: it predicts the score anywhere, with an uncertainty;
- choose the next configuration by maximizing an acquisition function: exploitation (high predicted score) against exploration (high uncertainty);
- evaluate it, add it to the history, repeat.
A stand-in score with a known truth: a broad peak of 0.78 at 0.25 and a higher, narrower one of 0.82 at 0.72.
The surrogate: a Gaussian process
Three evaluations so far: 0.15 and 0.35 (0.72943), 0.95 (0.700). Best so far \(f^+ = 0.72943\).
| \(x\) | mean \(\mu\) | sd \(\sigma\) | reading |
|---|---|---|---|
| 0.25 | 0.73076 | 0.00419 | between two points: nearly sure, just above \(f^+\) |
| 0.55 | 0.72212 | 0.01246 | far from any point: below \(f^+\), three times more uncertain |
| 0.72 | 0.71390 | 0.01318 | the real peak, but the surrogate knows nothing about it |
Expected improvement (EI): the formula
If the score at \(x\) were a normal variable with the surrogate's mean \(\mu\) and standard deviation \(\sigma\), by how much would it beat the best score so far, \(f^+\), on average? A failure to beat it counts as zero.
\[ \mathrm{EI}(x) = \underbrace{(\mu - f^+)\,\Phi(z)}_{\text{exploitation}} + \underbrace{\sigma\,\varphi(z)}_{\text{exploration}}, \qquad z = \frac{\mu - f^+}{\sigma} \]\(\Phi\): the cumulative distribution of the standard normal; \(\varphi\): its density. The first term rewards a high predicted mean, the second a large uncertainty.
Expected improvement, by hand: four iterations
The three evaluations above, 201 candidates between 0 and 1, a surrogate with length scale 0.15. Predict. Once iteration 1 has evaluated 0.25, where will iteration 2 go, and why?
Successive halving: a tournament
Most bad configurations are visibly bad early: after a few trees, or trained on a few rows (Jamieson & Talwalkar, 2016).
- start \(n = 27\) configurations on a small budget (10 trees each);
- keep the best third (\(\eta = 3\));
- give the survivors 3 × more budget; repeat until one is left.
HalvingRandomSearchCV.Successive halving, round by round
The same 27 boosted configurations on kc1, the budget counted in trees (10 → 270) or in rows (60 → 1,620). Predict. Whose winner will rank better once all 27 are scored at the full budget?
It optimizes the leak you gave it
bug_reports: filed after release; the model must flag risky modules before release, when the count is zero for everyone.
| ROC AUC | |
|---|---|
| best CV, without the column / with it | 0.792 / 0.916 |
| test, leaky winner, column filled in | 0.962 |
| test, honest winner | 0.804 |
test, leaky winner, as it will be used (bug_reports = 0) | 0.782 |
Every automated check passes. The leak is in the data: only someone who knows when each column is recorded can catch it.
A longer search overfits the validation data
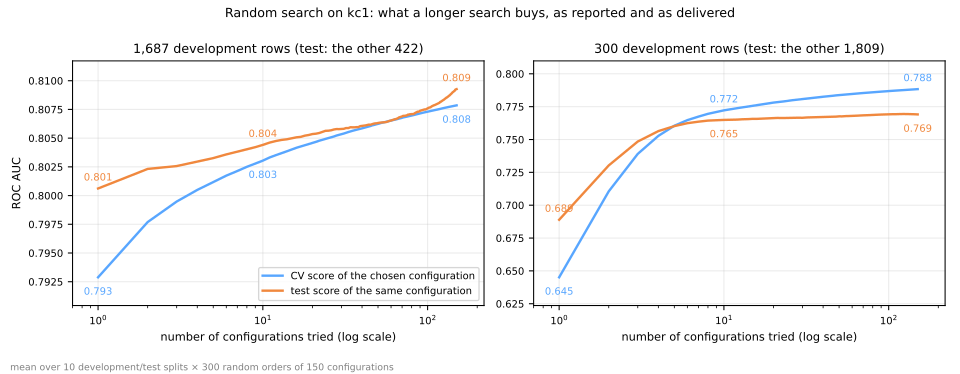
1,687 rows, 10 → 150 trials: CV 0.803 → 0.808, test 0.804 → 0.809. Honest.
300 rows: CV 0.772 → 0.788, test 0.765 → 0.769. Three quarters of the reported gain is luck.
Summary
- Tuning is an expensive, noisy black box: the budget is the number of calls.
- Design the space first: log scales and conditional knobs.
- Random beats grid when only a few knobs matter.
- Bayesian optimization learns where to look: the expected improvement trades a high mean against a large uncertainty.
- Successive halving stops bad trials early, if the early ranking predicts the final one: the budget unit matters.
- A search optimizes your leaks and its own luck: grade it on untouched data.
Grid or random, on vowels: steps 1 to 5
- phoneme: 5,404 vowels, oral or nasal, each described by 5 harmonic amplitudes; a boosted model with early stopping, scored by ROC AUC.
- Lock a test set away, set the baselines, write the search space, then a 3 × 3 × 3 grid against random search with the same 27 evaluations.
- Lab notebook (Jupyter or Colab, File → Upload notebook); from step 6 on it needs
!pip install optuna. - At every step, answer the Predict before running.
- Simulations: a grid built around the knob that matters (step 4) and the winner on fresh folds (step 5).
Pace: steps 1 to 3 in 10 min; step 4 and the first simulation in 10 min; step 5 and the second in 10 min.