Two mistakes, two prices
A miss (false negative)
- an undetected cancer can cost a life;
- an approved fraud costs the whole amount.
A false alarm (false positive)
- an unnecessary follow-up test costs money and a scare;
- a blocked card costs a phone call.
The path of this part
- Count the mistakes20 patients, four groups, the confusion matrix
- Accuracy is not enoughthe share of correct answers and its paradox
- One question per metricprecision, recall, specificity and the rest: a row or a column each
- Threshold and F1moving the line trades one mistake for the other; F1 sums up the two
The running example: 20 patients
A model gave each patient a score; later tests revealed who was sick. Ten sick, ten healthy.
| id | score | sick | id | score | sick | |
|---|---|---|---|---|---|---|
| P01 | 0.95 | 1 | P10 | 0.45 | 1 | |
| P05 | 0.75 | 0 | P12 | 0.35 | 1 | |
| P08 | 0.60 | 0 | P15 | 0.20 | 1 | |
| … | … | … | … | … | … |
Four groups, four counts
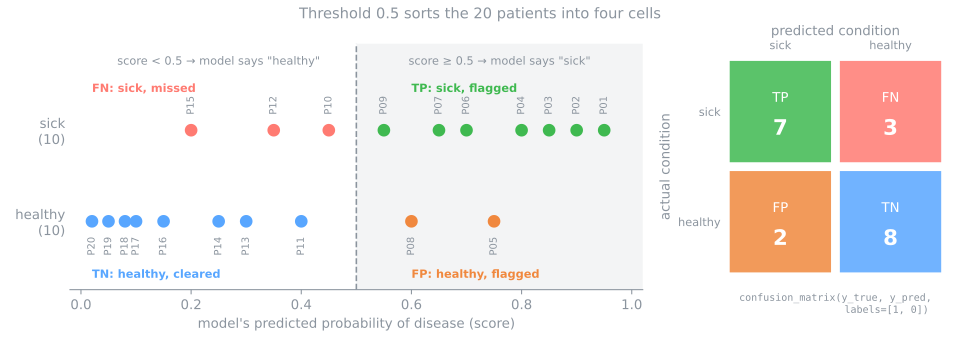
- TP = 7 true positive: sick and flagged
- FP = 2 false positive: healthy, flagged (false alarm)
- FN = 3 false negative: sick, not flagged (a miss)
- TN = 8 true negative: healthy, not flagged
The confusion matrix
The standard layout: actual in the rows, predicted in the columns, positive first.
| pred. sick | pred. healthy | |
|---|---|---|
| sick | TP = 7 | FN = 3 |
| healthy | FP = 2 | TN = 8 |
In scikit-learn, with labels=[1, 0]:
cm = confusion_matrix(y_true, y_pred, labels=[1, 0])
# [[7 3]      TP FN
#  [2 8]]     FP TN
tp, fn, fp, tn = cm.ravel()
labels, scikit-learn sorts the labels (0 first) and returns [[TN, FP], [FN, TP]]: the top-left cell becomes TN. Swapping the arguments transposes the matrix and swaps FP with FN silently.Accuracy: the diagonal over the total
\[ \text{accuracy} = \frac{TP + TN}{\text{everything}} = \frac{7 + 8}{20} = 0.750 \]- Here the classes are balanced (10 and 10), so a constant answer would score 0.50: 0.75 is a real improvement.
- Accuracy is a good summary when the classes are balanced and both mistakes cost the same.
The accuracy paradox
1,000 patients, 10 of them sick (1% prevalence):
| model | accuracy | recall |
|---|---|---|
| always "healthy" | 0.990 | 0.00 |
| lazy (finds 5 of 10, 10 false alarms) | 0.985 | 0.50 |
- The constant answer scores 99.0% and finds nobody.
- The model that at least finds half the sick scores less.
DummyClassifier).Simulator: one matrix, every metric
Predict. Press the lazy model (sensitivity 50%, specificity 99%, prevalence 1%). Will its accuracy beat the baseline that always predicts the majority?
Each metric reads a row or a column (1/2): the rows
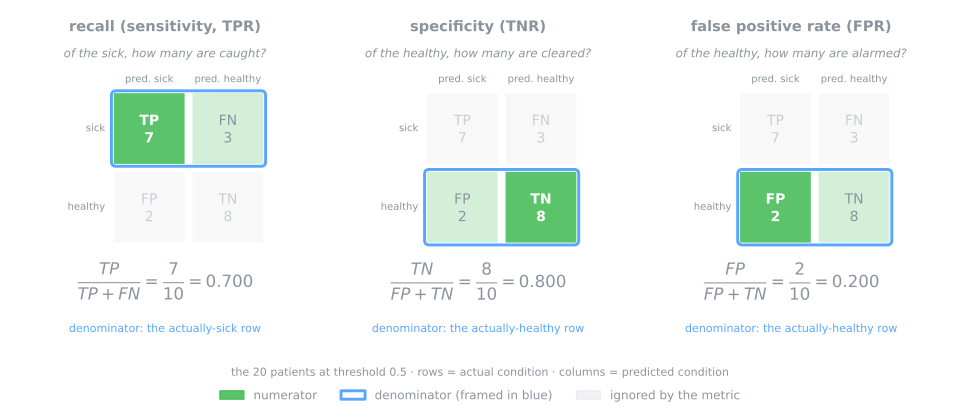
Green = numerator; blue frame = denominator. The rows are the actual condition: recall, specificity and FPR ask "of those who really were sick (or healthy), how many…?".
Each metric reads a row or a column (2/2): the columns
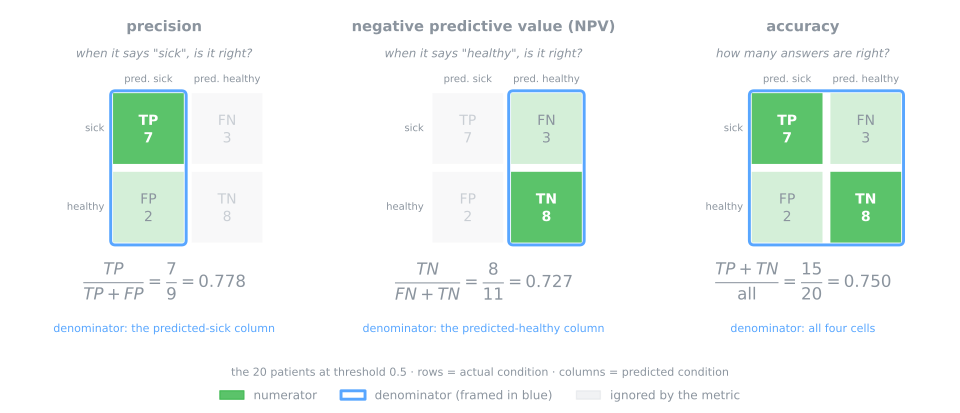
The columns are the prediction: precision and NPV ask "when the model said sick (or healthy), was it right?". Knowing which cells a metric uses tells you what it measures and what it ignores.
Precision and recall
Precision — the flagged column
\[ \frac{TP}{TP + FP} = \frac{7}{9} = 0.778 \]When it says "sick", is it right? Ignores the misses.
Matters when acting on an alarm is costly: spam filters, surgery, a team with 50 calls a day.
Recall — the sick row
\[ \frac{TP}{TP + FN} = \frac{7}{10} = 0.700 \]Of the sick, how many are caught? Ignores the false alarms.
Matters when a miss is costly: cancer screening, fraud, cracks in aircraft parts.
Also called PPV (positive predictive value), and sensitivity, or TPR (true positive rate), the vertical axis of the ROC (receiver operating characteristic) curve.
Specificity, FPR and NPV
Specificity
\[ \frac{TN}{TN + FP} \] \[ = \frac{8}{10} = 0.800 \]FPR
\[ \frac{FP}{FP + TN} \] \[ = \frac{2}{10} = 0.200 \]= 1 − specificity
NPV
\[ \frac{TN}{TN + FN} \] \[ = \frac{8}{11} = 0.727 \]- Specificity (or TNR, true negative rate) and FPR (false positive rate) read the healthy row: of the 10 healthy, 8 were left alone and 2 got a false alarm.
- NPV (negative predictive value) reads the sent-home column: of the 11 released, 8 really were healthy. It is what matters when it is the negative answer that turns into action.
All in one place
| metric | question | cells | value |
|---|---|---|---|
| accuracy | how many answers are right? | (7 + 8) / 20 | 0.750 |
| precision (PPV) | when it says "sick", is it right? | 7 / 9 | 0.778 |
| recall (TPR) | of the sick, how many are caught? | 7 / 10 | 0.700 |
| specificity (TNR) | of the healthy, how many are left alone? | 8 / 10 | 0.800 |
| FPR | of the healthy, how many get an alarm? | 2 / 10 | 0.200 |
| NPV | when it says "healthy", is it right? | 8 / 11 | 0.727 |
pos_label=0.The threshold is a decision
| threshold | TP | FP | FN | TN | precision | recall |
|---|---|---|---|---|---|---|
| 0.3 | 9 | 4 | 1 | 6 | 0.692 | 0.900 |
| 0.5 | 7 | 2 | 3 | 8 | 0.778 | 0.700 |
| 0.7 | 5 | 1 | 5 | 9 | 0.833 | 0.500 |
Both curves are staircases
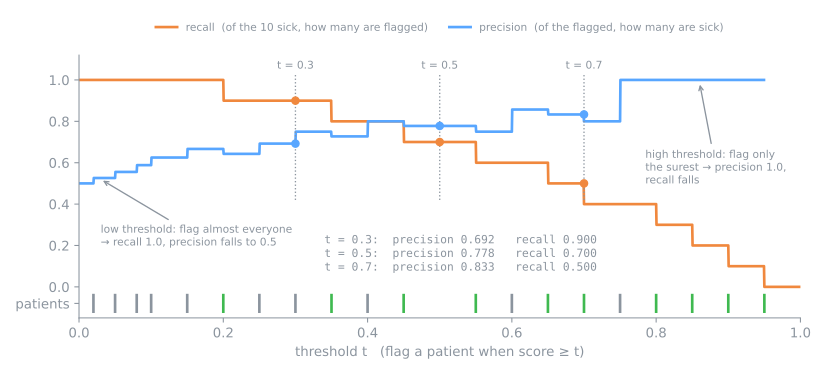
They only change when the threshold crosses a patient's score. Recall can only fall; precision tends to rise, with setbacks (from 0.65 to 0.70 it falls, because P07 is sick).
F1: one number from two
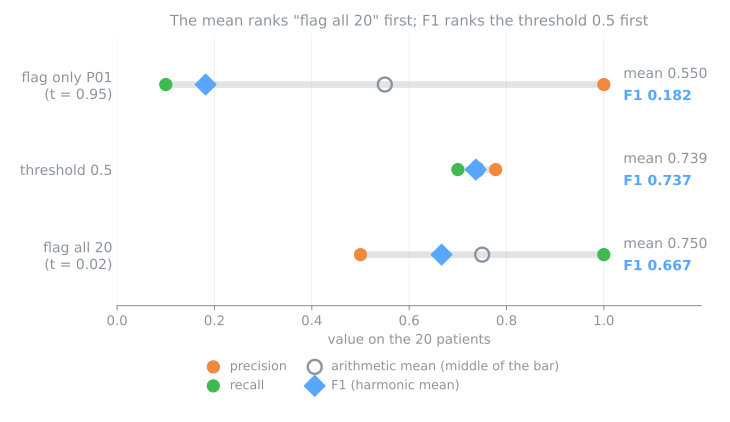
\[ F_1 = \frac{2 \cdot P \cdot R}{P + R} = \frac{2\,TP}{2\,TP + FP + FN} = \frac{14}{19} = 0.737 \]\(P\) = precision, \(R\) = recall. Notice what is not there: TN.
The recipe
- Build the matrix before any single number.
- Choose the metric by the question, not by habit.
- Print the baseline next to it. A score without a reference is not a result.
- Remember the threshold is yours, and choose it on validation.
| common mistake | fix |
|---|---|
reading scikit-learn's default matrix (no labels) as if TP were the top-left cell | pass labels=[1, 0] |
| reporting accuracy alone | accuracy next to the baseline, plus recall |
| comparing models on one metric | a scoreboard with several |
Diabetes screening: steps 1 to 7
- 768 women, 8 measurements, a tool that decides who gets referred to a full diagnostic test.
- Notebook on Colab (in Portuguese): nothing to download. Save a copy to your Drive.
- In each step, answer the Predict before running.
- Simulations: who are the misses? (step 5) and what if diabetes were rare? (step 7).
Pace: steps 1 to 3 in 12 min; 4 to 6 in 15 min; step 7 and the simulation in 13 min.