The path of this part
- Where k-means failsmoons, rings, stretched and uneven groups
- Dense regionsDBSCAN: core, border, noise
- One density or manythe k-distance plot; HDBSCAN
- Choose an algorithmk-means, hierarchical, DBSCAN, HDBSCAN
What k-means assumes
Each group is a convex cell with straight boundaries halfway between centers, and every point pays the same squared distance:
- groups are convex and roughly round;
- groups have similar spread;
- there is no noise: every point is assigned somewhere;
- you know \(k\).
Five shapes, k-means told the right \(k\)
ARI (Adjusted Rand Index): agreement with the true groups, 1 = identical, about 0 = chance. Predict. Which shapes will k-means recover? Will the silhouette warn you about the others?
| data | \(k\) | silhouette | ARI |
|---|---|---|---|
| blobs | 3 | 0.823 | 1.000 |
| moons | 2 | 0.489 | 0.253 |
| circles | 2 | 0.356 | −0.002 |
| anisotropic | 3 | 0.501 | 0.555 |
| densities | 3 | 0.605 | 0.436 |
Simulator: where k-means fails
Try. Cycle through the shapes and vary \(k\). Is there a \(k\) that fixes a ring?
Hierarchical clustering
k-means returns one flat partition for one chosen \(k\). Agglomerative clustering builds the whole tree of merges, the dendrogram, and lets you choose the number of groups afterwards by cutting it.
DBSCAN: dense regions
A group is a dense region, separated by sparse ones. Two parameters: a radius eps and a count min_samples.
core
at least min_samples points within eps, itself included
border
not core, but within eps of a core point
noise
neither: label −1, not forced into a group
DBSCAN by hand: ten points, eps = 1.5, min_samples = 4
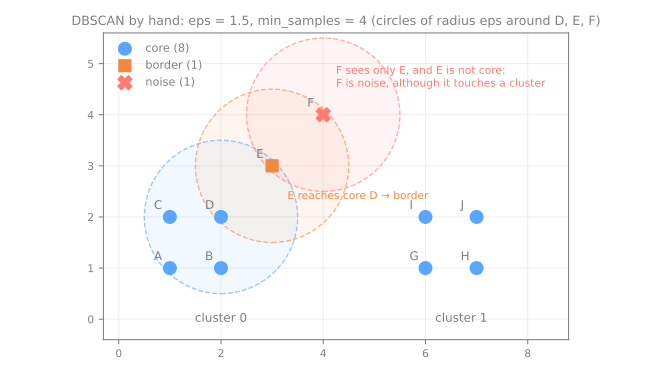
A, B, C, D: the left square (D also sees E); G, H, I, J: the right one. E = (3, 3) sees D and F; F = (4, 4) sees only E.
eps of E, and E belongs to a cluster. Is F in the cluster?No: E has only 3 points within 1.5, so it is a border point, and clusters grow only through core points. F is noise.
Choosing eps: one value, one density
The k-distance plot: each point's distance to its \(k\)-th neighbor, sorted; read eps at the knee. "Densities": the tight groups need about 0.07, the loose one about 0.3.
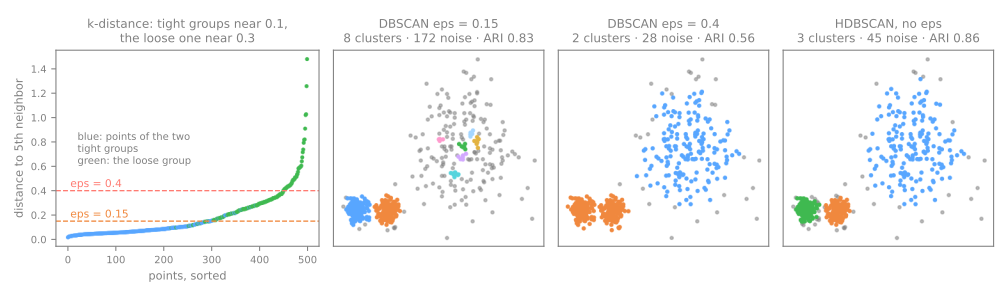
eps | 0.15 | 0.3 | 0.6 | 0.8 |
|---|---|---|---|---|
| clusters | 8 | 6 | 2 | 1 |
| noise | 172 | 63 | 5 | 4 |
| ARI | 0.825 | 0.397 | 0.619 | −0.003 |
eps means one density.HDBSCAN: every eps at once
Runs DBSCAN for every eps, builds a hierarchy of clusters and keeps those that persist the longest, each at its own density. One parameter: min_cluster_size.
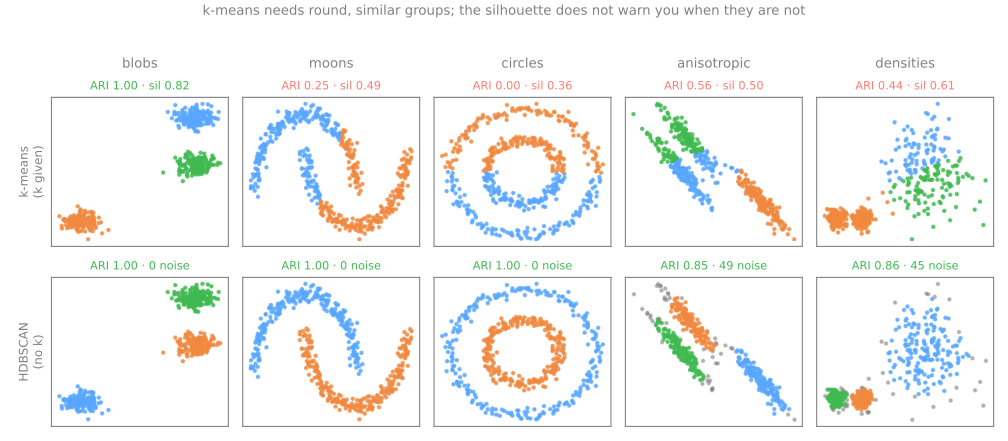
| HDBSCAN, no \(k\) | blobs | moons | circles | anisotropic | densities |
|---|---|---|---|---|---|
| clusters · noise | 3 · 0 | 2 · 0 | 2 · 0 | 3 · 49 | 3 · 45 |
| ARI | 1.000 | 1.000 | 1.000 | 0.852 | 0.856 |
The noise points are tails and fringes; the assigned ones are all right. This is why BERTopic uses HDBSCAN.
Choosing an algorithm
| k-means | hierarchical (Ward) | DBSCAN | HDBSCAN | |
|---|---|---|---|---|
| a group is | nearest a center | a branch of merges | a dense region | dense, at its own density |
| you choose | \(k\) | the cut (\(k\)) | eps, min_samples | min_cluster_size |
| shapes | convex, round | depends on the linkage | any | any, mixed densities |
| noise | forced in | forced in | −1 | −1 |
| new points | predict | no | no | no |
Summary
- k-means assumes convex groups of similar spread, no noise and a known \(k\); the silhouette shares that idea of a good group and does not warn you.
- DBSCAN calls a group a dense region: clusters grow through core points, and noise gets −1.
- One global
epsmeans one density; HDBSCAN keeps each cluster at its own density, with one parameter,min_cluster_size. - In many dimensions "dense" loses meaning: the lab measures it on 13 wine measurements.
- Start with k-means; switch for a concrete reason, not for a higher index.
Other algorithms, and the answer key, steps 7 to 9
- Same notebook, same session: the steps use
df,X,Z,scalers,labelsandcultivarfrom steps 1 to 6. - 7. try DBSCAN and HDBSCAN · 8. look at the clusters with PCA (principal component analysis) · 9. open the seal: audit every decision.
- Lab notebook, from step 7. At every step, answer the Predict before running.
- Simulations: how big must a cluster be? (step 7) and the four scalers, audited (step 9).
Pace: step 7 and the first simulation in 10 min; step 8 in 5 min; step 9 and the second in 10 min.