Structure is free, labels are expensive
Clustering receives only the table \(X\), no labels, and returns groups of similar rows.
segment
customers
compress
a palette of \(k\) colors is a clustering of the pixels
organize
documents: the road to topic modeling
The path of this lesson
- Define and judgedistance, internal and external indices
- k-meansLloyd's algorithm by hand, local minima
- Choosing kelbow, silhouette, other indices, scaling
- Beyond centerswhere k-means fails; DBSCAN, HDBSCAN
- Choose and interpretwhich algorithm, what each group is
What clustering is, and how it is judged
| classification | clustering | |
|---|---|---|
| input | \(X\) and \(y\) | only \(X\) |
| "correct" means | predicting \(y\) on new rows | satisfying a criterion you chose |
| validated with | a held-out test set | no test set is possible without labels |
what "similar" means
a distance adds up columns: grams drown millimeters. Scaling is part of the clustering.
how it is judged
internal indices use only \(X\); external ones (the Adjusted Rand Index, ARI) compare with known labels, here only to check the internal ones.
The Adjusted Rand Index, by hand
Truth: \(\{1,2,3\}, \{4,5,6\}\). A clustering: \(\{1,2\}, \{3,4\}, \{5,6\}\).
- Of the 15 pairs, they agree on 10: (1,2) and (5,6) together in both; 8 cross pairs apart in both.
- Rand index \(= 10/15 = 0.667\). But random labels also agree on many pairs.
- The ARI subtracts chance: 0.242.
Answers: 1.0 (the ARI ignores names) and 0.0.
k-means: points near a center
\[ J = \sum_{j=1}^{k} \sum_{x_i \in C_j} \lVert x_i - \mu_j \rVert^2, \qquad \mu_j = \text{mean of } C_j \]The inertia: each point's squared distance to the center of its group. Circular: centers depend on groups, groups on centers. Lloyd's algorithm alternates:
- assign: each point goes to its nearest center;
- update: each center moves to the mean of its points.
Lloyd by hand: a bad start
Two unit squares, around \((1.5, 1.5)\) and \((6.5, 5.5)\). Both centers start in the left one: \(c_1 = (1,1)\), \(c_2 = (2,2)\).
| point | coordinates | \(d^2\) to \(c_1\) | \(d^2\) to \(c_2\) | group |
|---|---|---|---|---|
| \(x_1, x_2, x_3\) | (1,1), (2,1), (1,2) | 0, 1, 1 | 2, 1, 1 | 1 (ties go to the first) |
| \(x_4\) | (2, 2) | 2 | 0 | 2 |
| \(x_5 \dots x_8\) | the right square | 41 to 61 | 25 to 41 | 2 |
Three iterations
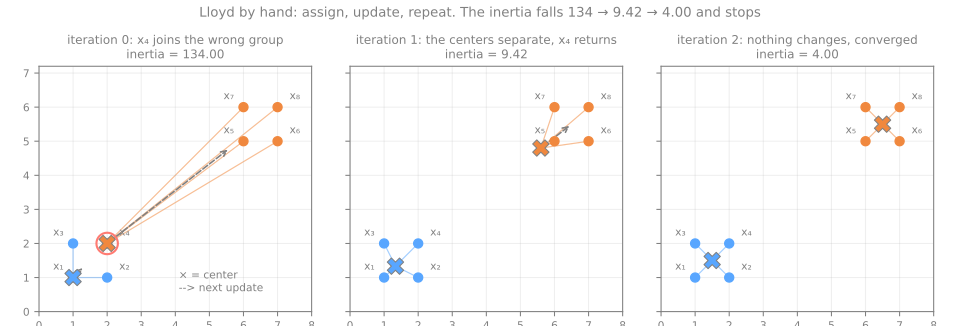
- Update: \(c_2\) = mean of \(x_4 \dots x_8\) = \((5.6, 4.8)\), dragged to the right; \(x_4\) is now closer to \(c_1\) (0.89 against 20.80) and switches back.
- Inertia 134 → 9.42 → 4.00: the first iteration does almost all the work. Convergence = no assignment changed.
Simulator: Lloyd, one step at a time
The spokes join each point to its center; the inertia is the sum of their squared lengths. Its history never goes up.
Simulator: try to beat the mean
Try. Drag the centers and watch which group contributes most to the inertia. Then move every center to its mean.
Initialization and local minima
300 points in three well-separated blobs; k-means with one start, 100 seeds.
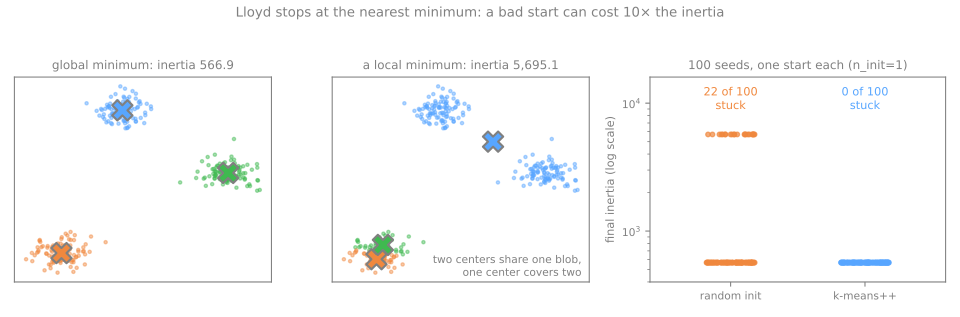
Random starts: stuck in 22 of 100 runs (inertia up to 5,703.3, ten times the best, 566.9). k-means++: 0. Random with n_init=10 (restart, keep the lowest inertia): 0. Two centers share one blob, and moving any single center or point makes it worse.
Choosing \(k\): the inertia cannot
- Adding a center can only lower the inertia; with \(k = n\) it is 0.
- The elbow: the \(k\) after which a new group buys much less. A heuristic, often ambiguous, read on a curve that always goes down.
The silhouette, by hand
\[ s(i) = \frac{b(i) - a(i)}{\max(a(i), b(i))} \in [-1, 1] \]\(a\): mean distance to its own group; \(b\): to the nearest other group. Near 1: comfortable; near 0: on a border; negative: closer to another group.
\(x_1 = (1,1)\), the converged squares
\(a = (1 + 1 + 1.414)/3 = 1.1381\)
\(b\) = mean of 6.403, 7.211, 7.071, 7.810 = 7.1239
\(s = (7.1239 - 1.1381)/7.1239 = \mathbf{0.8402}\)
all eight points
outer corners 0.8402, inner corners 0.8011
Simulator: the silhouette of every point
Click a point to see its two circles: \(a\) in its own color, \(b\) in the neighbor's. The bars are every point's silhouette, sorted by group.
Two more internal indices
Calinski–Harabasz, CH (higher is better)
\[ \mathrm{CH} = \frac{B/(k-1)}{W/(n-k)} \]Eight points: \(B = 82\), \(W = 4\): \(\mathrm{CH} = (82/1)/(4/6) = 123\)
Davies–Bouldin, DB (lower is better)
for each group, its worst neighbor: \((s_i + s_j)/d(\mu_i, \mu_j)\)
Eight points: \((0.7071 + 0.7071)/6.4031 = 0.2209\)
On real data: 342 penguins
Four standardized measurements; the species (Adelie 151, Gentoo 123, Chinstrap 68) kept aside, only for the ARI.
| \(k\) | inertia | silhouette | CH | DB | ARI (check) |
|---|---|---|---|---|---|
| 2 | 565.7 | 0.532 | 482.2 | 0.714 | 0.655 |
| 3 | 379.4 | 0.447 | 441.7 | 0.944 | 0.793 |
| 4 | 300.4 | 0.400 | 400.4 | 0.944 | 0.637 |
| 5 | 232.6 | 0.378 | 411.2 | 0.973 | 0.572 |
Two different questions
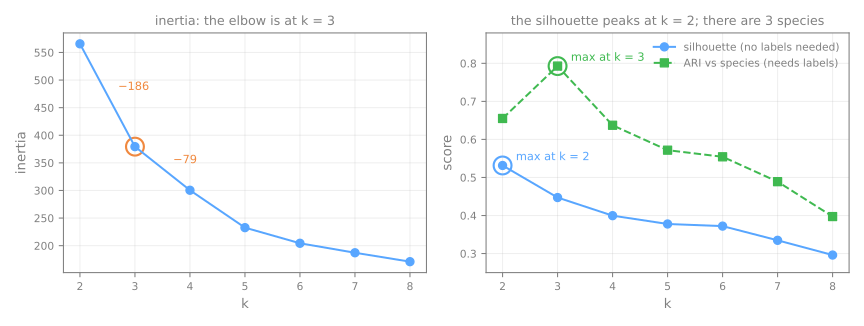
- The elbow says 3 (the inertia drops 186 from 2 to 3, then only 79); silhouette, CH and DB all say 2; the species are 3.
- Adelie and Chinstrap differ mainly in bill length: merging them really is more compact.
Simulator: sweep \(k\) on eight datasets
Try. Clean blobs, unequal sizes, circles, noise: when do the elbow and the silhouette agree?
The silhouette of pure noise
300 uniform points: no structure at all.
| \(k\) | 2 | 3 | 4 | 5 |
|---|---|---|---|---|
| silhouette | 0.359 | 0.379 | 0.4 | 0.382 |
A ruler: rerun the same pipeline with each column shuffled independently and report both silhouettes. The lab does it.
Scaling matters, and the silhouette will not tell you
Standard deviations: body mass 801.95 g, bill depth 1.97 mm, about 400 times smaller.
| silhouette | ARI with species | |
|---|---|---|
| raw units | 0.580 | 0.331 |
| standardized | 0.447 | 0.793 |
Raw: three weight bands, well separated. An internal index compares partitions of the same space; when the scaling changes, the ruler changes. Scale by an argument about units.
What k-means assumes
Each group is a convex cell with straight boundaries halfway between centers, and every point pays the same squared distance:
- groups are convex and roughly round;
- groups have similar spread;
- there is no noise: every point is assigned somewhere;
- you know \(k\).
Five shapes, k-means told the right \(k\)
| data | \(k\) | silhouette | ARI |
|---|---|---|---|
| blobs | 3 | 0.823 | 1.000 |
| moons | 2 | 0.489 | 0.253 |
| circles | 2 | 0.356 | −0.002 |
| anisotropic | 3 | 0.501 | 0.555 |
| densities | 3 | 0.605 | 0.436 |
Simulator: where k-means fails
Try. Cycle through the shapes and vary \(k\). Is there a \(k\) that fixes a ring?
Hierarchical clustering
k-means returns one flat partition for one chosen \(k\). Agglomerative clustering builds the whole tree of merges, the dendrogram, and lets you choose the number of groups afterwards by cutting it.
DBSCAN: dense regions
A group is a dense region, separated by sparse ones. Two parameters, eps and min_samples:
core
at least min_samples points within eps, itself included
border
not core, but within eps of a core point
noise
neither: label −1, not forced into a group
DBSCAN by hand: ten points, eps = 1.5, min_samples = 4
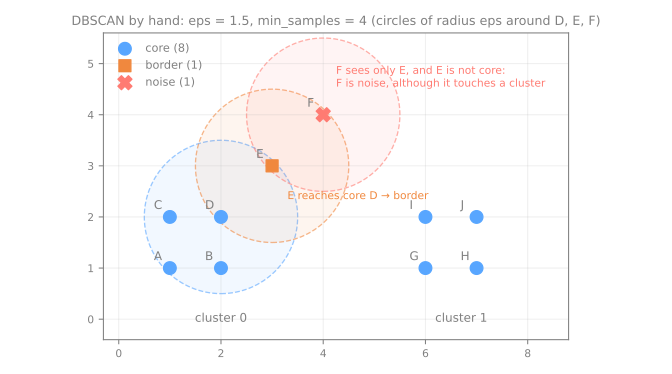
A, B, C, D: the left square (D also sees E); G, H, I, J: the right one. E = (3, 3) sees D and F; F = (4, 4) sees only E.
eps of E, and E belongs to a cluster. Is F in the cluster?No: E has only 3 points within 1.5, so it is a border point, and clusters grow only through core points. F is noise.
Choosing eps: one value, one density
The k-distance plot: each point's distance to its \(k\)-th neighbor, sorted; read eps at the knee. "Densities": the tight groups need about 0.07, the loose one about 0.3.
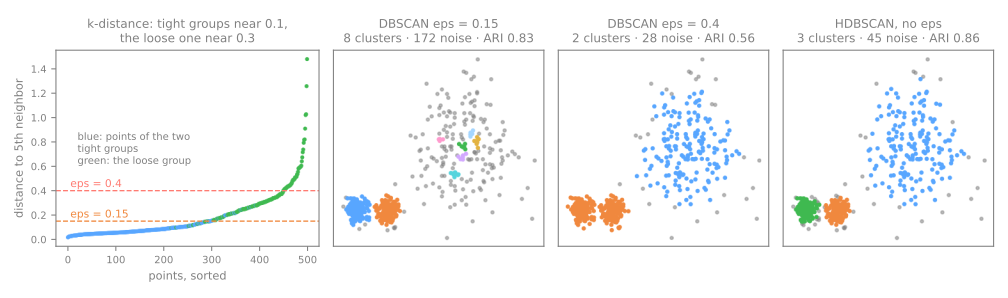
eps | 0.15 | 0.3 | 0.6 | 0.8 |
|---|---|---|---|---|
| clusters | 8 | 6 | 2 | 1 |
| noise | 172 | 63 | 5 | 4 |
| ARI | 0.825 | 0.397 | 0.619 | −0.003 |
eps means one density.HDBSCAN: every eps at once
Runs DBSCAN for every eps, builds a hierarchy of clusters and keeps those that persist the longest, each at its own density. One parameter: min_cluster_size.
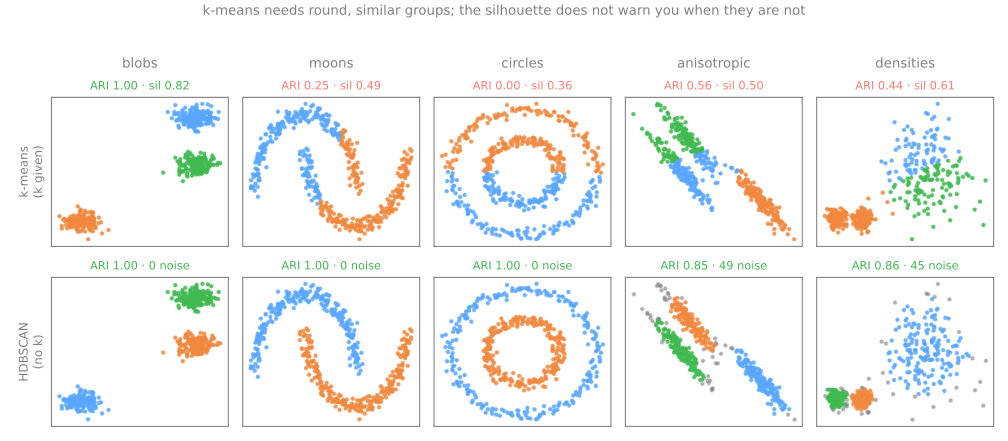
| HDBSCAN, no \(k\) | blobs | moons | circles | anisotropic | densities |
|---|---|---|---|---|---|
| clusters · noise | 3 · 0 | 2 · 0 | 2 · 0 | 3 · 49 | 3 · 45 |
| ARI | 1.000 | 1.000 | 1.000 | 0.852 | 0.856 |
The noise points are tails and fringes; the assigned ones are all right. This is why BERTopic uses HDBSCAN.
Choosing an algorithm
| k-means | hierarchical (Ward) | DBSCAN | HDBSCAN | |
|---|---|---|---|---|
| a group is | nearest a center | a branch of merges | a dense region | dense, at its own density |
| you choose | \(k\) | the cut (\(k\)) | eps, min_samples | min_cluster_size |
| shapes | convex, round | depends on the linkage | any | any, mixed densities |
| noise | forced in | forced in | −1 | −1 |
| new points | predict | no | no | no |
Four questions before believing a clustering
- Did I scale? If not, it probably sorts by the column with the largest unit.
- Did I restart enough? An inertia ten times too high is possible.
- Where did \(k\) come from? The silhouette preferred 2 penguin groups where there are 3 species.
- Did I compare with shuffled data? Pure noise reaches a silhouette of 0.40.
Interpreting clusters
Back to the original columns, with a groupby:
| cluster | bill length | bill depth | flipper | mass (g) | n |
|---|---|---|---|---|---|
| 0 | 47.5 | 15.0 | 217.2 | 5076.0 | 123 |
| 1 | 38.2 | 18.1 | 188.4 | 3584.7 | 132 |
| 2 | 47.5 | 18.8 | 196.9 | 3902.0 | 87 |
Heavy birds with long flippers and shallow bills; long and deep bills; small birds with short bills. (Cluster 0 is exactly the Gentoo; the only confusion is Adelie against Chinstrap.)
Summary
- No labels, no answer key: the algorithm always returns a partition.
- k-means minimizes the inertia by alternating assign and update; restart it (
n_init). - Silhouette, CH, DB measure separation, not whether the partition is the one you want; noise scores 0.40.
- Scale by an argument about units, not by an index.
- k-means wants round groups; DBSCAN and HDBSCAN find dense regions and mark noise.
Clustering 178 wines
- 13 chemical measurements; the cultivar column is sealed until the last step: every decision is taken without labels.
- Download the lab notebook and open it in Jupyter or Colab.
1. load, and seal the cultivar
2. scale, and why the indices cannot decide it
3. choose \(k\): elbow and silhouette
4. the ruler: shuffled data
5. fit \(k = 3\), inspect each cluster
6. profile in the original units
7. try DBSCAN and HDBSCAN
8. look at the clusters with PCA (principal component analysis)
9. open the seal: audit every decision