Where the fundamental part left off
- PCA: the eigenvectors of the covariance; the eigenvalue is the variance kept; it has
transform. - t-SNE and UMAP: maps that keep each point's neighbors; sizes, distances between groups and axes mean nothing.
- Seven forbidden statements, given as rules.
The path of this part
- PCA's pitfallsunits, leakage, target, factors, one-hot
- Score a maptrustworthiness; Isomap and the manifold family
- Stress-test t-SNEgroups in noise; axes and seeds
- New points, every scaleUMAP's
transform; trustworthiness at every k
Five PCA pitfalls
- Not standardizing columns in different units: you measure the unit (wine: PC1 = proline, 99.8%).
- Fitting before the split: the test rows shape the projection.
- Assuming high-variance components are the useful ones for prediction: PCA never looks at the target.
- Reading components as real-world factors: signs are arbitrary, and close eigenvalues allow any rotation.
- PCA on one-hot columns without thinking: a 0/1 column with share \(p\) of ones has variance \(p(1-p)\), so rare categories vanish.
A score for a map: trustworthiness
Of the \(k\) nearest neighbors of each point on the map, how many were really neighbors in the original space? Intruders cost more the farther away they really were. 1 = no intruders.
random map
PCA on the Swiss roll
Isomap
One bet, many methods
The bet: Euclidean distance is only trustworthy locally. MDS = multidimensional scaling; LLE = locally linear embedding.
| method | idea | status today |
|---|---|---|
| Kernel PCA | PCA in a kernel's feature space | choose the kernel; \(O(n^2)\) memory |
| MDS | keep all pairwise distances | historical basis; crowding |
| Isomap | MDS on graph (geodesic) distances | short-cut edges between layers |
| LLE / Laplacian eigenmaps | local reconstructions / graph Laplacian | ancestors of UMAP |
| t-SNE | match neighbor distributions | visualization standard since 2008 |
| UMAP | fuzzy graph + optimized layout | current standard at scale |
| Autoencoder | a network learns map and inverse | reversible; bridge to deep learning |
t-SNE finds groups in noise
200 points of uniform noise in 10 columns. A k-means clustering scored by its silhouette (near 1 for separated groups, near 0 when there are none) says how "groupy" a set of points looks.
| best silhouette | trustworthiness | |
|---|---|---|
| 10-column noise itself | 0.09 | |
| its t-SNE map, perplexity 30 | 0.38 | 0.86 |
| 4-column noise, t-SNE map | 0.43 | 0.97 |
Axes and runs
The loss depends only on distances on the map: rotating or mirroring it changes nothing. Digits, random initialization, seed 0 against seeds 1, 2, 3:
horizontal axes |correlation|
1.0, 0.0, 0.1
seed 2 came out rotated a quarter turn
neighbors in common
90%, 94%, 85%
on noise: only 47%
init="pca" (the default) makes the map reproducible, which is not the same as stable.UMAP places new points, measured
The digits: UMAP fitted on 80% of the images, then reducer.transform on the other 20%.
hasattr(PCA(), "transform")    # True
hasattr(TSNE(), "transform")   # False
reducer = umap.UMAP(n_neighbors=15, min_dist=0.1, random_state=0).fit(X_tr)
E_te = reducer.transform(X_te)                 # 360 new images, same map
new image next to its own digit
t-SNE
no transform: adding points means recomputing the whole map, which moves the old points too
PCA vs t-SNE, side by side
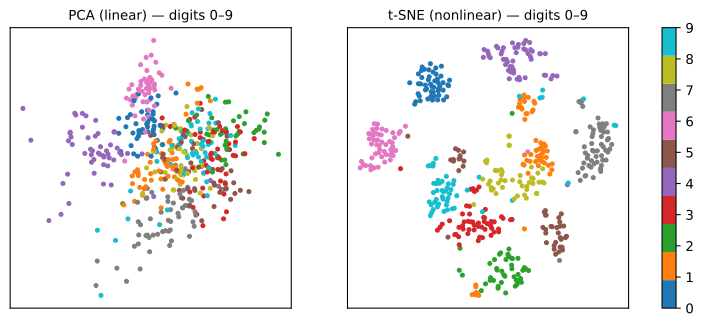
Trustworthiness on the digits, for neighborhoods of size \(k\):
| k=5 | k=30 | k=100 | |
|---|---|---|---|
| PCA | 0.830 | 0.830 | 0.835 |
| t-SNE | 0.995 | 0.985 | 0.963 |
| UMAP | 0.989 | 0.983 | 0.961 |
t-SNE splits the 1s into islands and cuts the roll into pieces. No winner until you say which scale you care about.
Summary: a reduction needs a number
| to claim that... | measure |
|---|---|
| \(k\) components keep almost everything | cumulative explained variance; reconstruction error |
| the map keeps each point's neighbors | trustworthiness, at more than one \(k\) (random ≈ 0.5) |
| the groups on the map exist | a clustering in the original space; a null comparison |
| the picture is stable | neighbor overlap across seeds, perplexities, samples |
| the map works on new data | transform (PCA, UMAP), scored on held-out rows |
Putting numbers on the maps, steps 5 to 8
- Same notebook and session as the fundamental lab:
X,y,X_new,maps,reducerfrom steps 1 to 4. - Steps: 5. score the maps with trustworthiness · 6. perplexity · 7. UMAP:
n_neighbors,min_dist, new images · 8. test a forbidden statement. - At every step, answer the Predict before running.
- Simulations: a map that knows nothing (step 5) and t-SNE has no transform, so start over (step 7).
Pace: step 5 and the first simulation in 8 min; step 6 in 5 min; step 7 and the second simulation in 12 min; step 8 in 5 min.