Why reduce? The reason picks the method
| goal | what the method must deliver | typical method |
|---|---|---|
| see the data | a 2-D or 3-D picture; local fidelity is enough | t-SNE, UMAP |
| compress / speed up | reconstruction, and a transform for new data | PCA |
| remove noise / collinearity | drop the low-variance directions | PCA |
| feed another model | an honest fit/transform, no leakage | PCA (almost always) |
The path of this part
- The cursedistances lose their contrast
- PCA by handcenter, covariance, eigenvectors, project
- Scale, choose k, rebuildunits, explained variance, reconstruction error
- Bend: t-SNE and UMAPwhere PCA runs out; neighbors instead of variance
- Read and chooseseven forbidden statements; the goal decides
The curse of dimensionality
Take random points in the unit cube and look at the distances between them.
Simulator: distances in \(d\) dimensions
Push \(d\) up and watch the histogram of distances collapse into a spike.
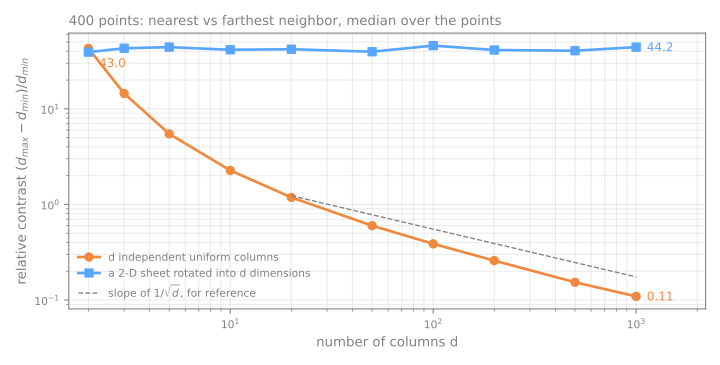
Relative contrast, measured
\((d_{\max} - d_{\min})/d_{\min}\), median over 400 points:
| \(d\) | noise columns | 2-D sheet in \(d\) columns |
|---|---|---|
| 2 | 42.97 | 39.23 |
| 10 | 2.27 | 41.51 |
| 100 | 0.39 | 45.88 |
| 1000 | 0.11 | 44.24 |
PCA: the directions of maximum variance
Centered data \(X\); covariance \(C = \frac{1}{n-1} X^\top X\).
\[ w_1 = \arg\max_{\|w\|=1} w^\top C\, w \qquad \text{EVR}_k = \frac{\lambda_k}{\sum_j \lambda_j} \]- \(w_1\) is the eigenvector of \(C\) with the largest eigenvalue \(\lambda_1\); the next is orthogonal to it, and so on.
- \(\lambda_k\) is the variance captured by component \(k\); EVR is the explained variance ratio.
PCA by hand, step by step
Five points: (2, 4), (4, 2), (5, 5), (6, 8), (8, 6). Predict. Where will PC1 point, and what share of the variance will it keep? Then step through center → covariance → eigenvalues → eigenvector → project → reconstruct.
The same in code, and two details
np.linalg.eighreturns the eigenvalues in ascending order: the best direction comes last. Forgetting to sort is a silent bug.- scikit-learn's
PCAagrees:explained_variance_ratio_= [0.8, 0.2]. - Signs are arbitrary: \(w\) and \(-w\) are both eigenvectors; read relative signs inside a component, never the absolute sign.
- New points need no refitting: \((9,7) - (5,5) = (4,2)\), and \((4+2)/\sqrt2 = 4.243\), exactly
pca.transform.
Simulator: rotate the line
Predict. As you turn the line, at how many angles does the captured variance peak? Then press find PC1.
The scaling question
Wine: 13 chemical measurements of 178 wines. Proline has standard deviation 314.9; hue is around 1.
| variance ratio of PC1, PC2, PC3 | largest weights in PC1 | |
|---|---|---|
| raw columns | 0.998, 0.002, 0.0 | proline 1.000 |
| standardized | 0.362, 0.192, 0.111 | flavanoids, total phenols, OD280 |
99.8% is not a discovery about wine: it is a measurement of the unit of proline.
Does it matter downstream?
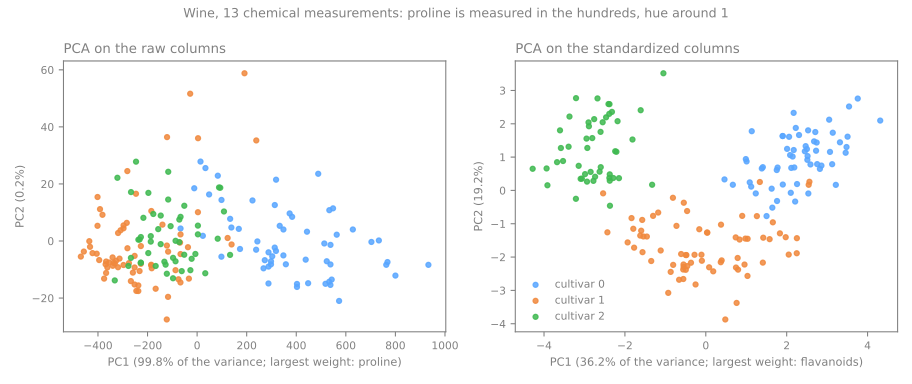
A k-NN classifier (k-nearest neighbors) that sees only the two PCA coordinates, scored on 30% of the wines:
raw → PCA(2)
scaled → PCA(2)
Choosing \(k\): 64 pixels of digits
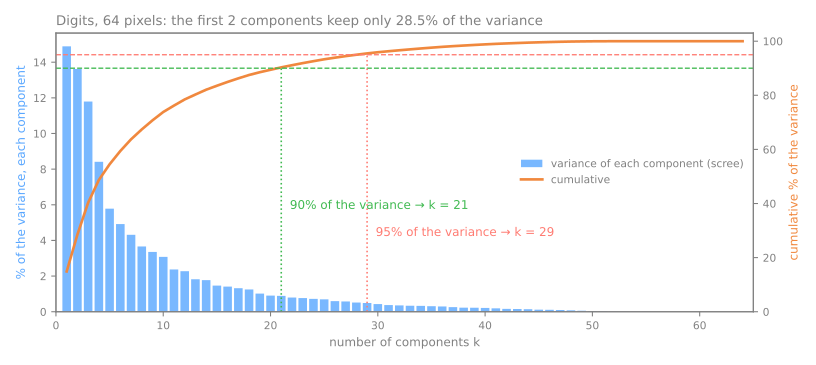
- 2 components keep 28.5%: a 2-D PCA picture shows less than a third.
- 90% needs 21, 95% needs 29, 99% needs 41.
PCA(n_components=0.95)searches for you.
Criteria, most trusted first: a cumulative-variance threshold; the elbow (subjective); downstream performance on validation data; Kaiser's rule (fragile).
Reconstruction: what \(k\) components keep
| \(k\) | kept | error / image | discarded \(\lambda\) |
|---|---|---|---|
| 1 | 14.9% | 1022.6 | 1022.6 |
| 2 | 28.5% | 858.9 | 858.9 |
| 10 | 73.8% | 314.5 | 314.5 |
| 29 | 95.5% | 54.3 | 54.3 |
| 64 | 100.0% | 0.0 | 0.0 |
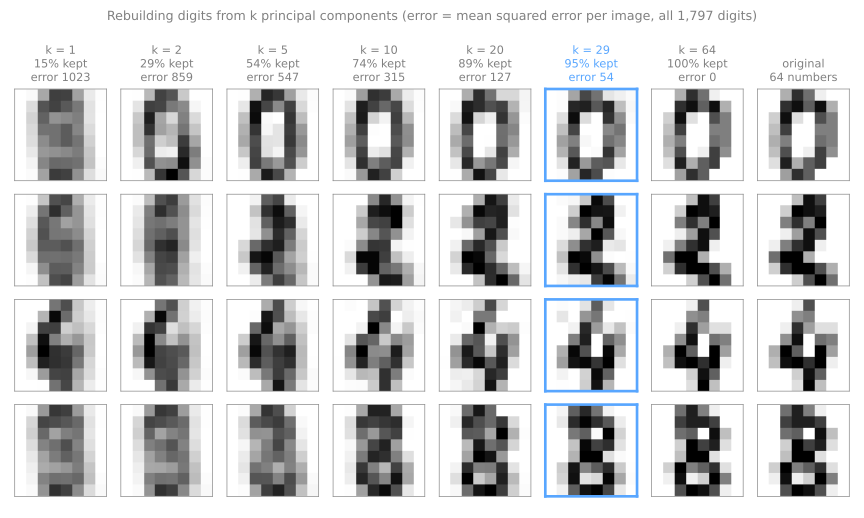
Simulator: rebuild an image from \(k\) components
Predict. How few components does your eye need before it stops objecting?
Where PCA runs out
PCA can only rotate and project: it moves the axes, never bends them.
The Swiss roll: a 2-D sheet rolled up in 3-D. Two points on opposite layers are close in straight line, far along the sheet.
Simulator: the Swiss roll
Tick mark a pair of points, then project with PCA. Euclidean distance goes through the empty space; geodesic distance walks along the sheet.
t-SNE in three steps
- Neighborhoods in the data: a Gaussian around each point, its width tuned per point to a perplexity ("effective number of neighbors"). Dense and sparse regions get different widths.
- Neighborhoods on the map: a Student-t, with heavy tails, to make room in 2-D. Side effect: distances between groups stop meaning anything.
- Minimize the Kullback–Leibler divergence \(\text{KL}(P\,\|\,Q)\): true neighbors drawn far apart are expensive; far points drawn close are almost free.
Simulator: real t-SNE, in your browser
Try. Run it on uniform noise; change only the perplexity; compare groups of different sizes.
What a t-SNE map does not tell you, measured
| data | t-SNE | |
|---|---|---|
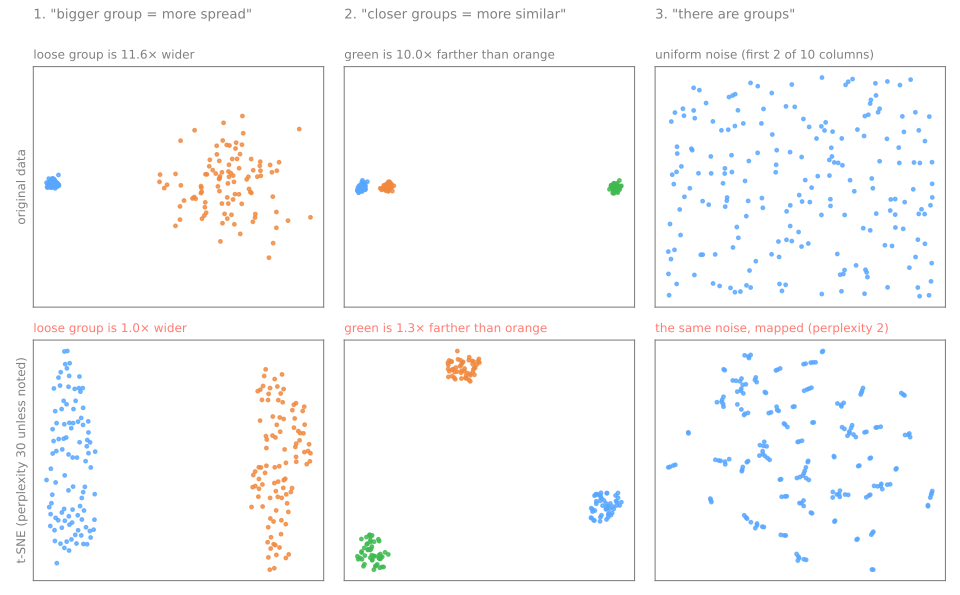
| how many times wider the loose group is | 11.6 | 1.0 |
| how many times farther the far group is | 10.0 | 1.3 |
Perplexity changes the picture
| perplexity | distance ratio |
|---|---|
| 2 | 3.3 |
| 5 | 1.1 |
| 30 | 1.3 |
| 100 | 7.0 |
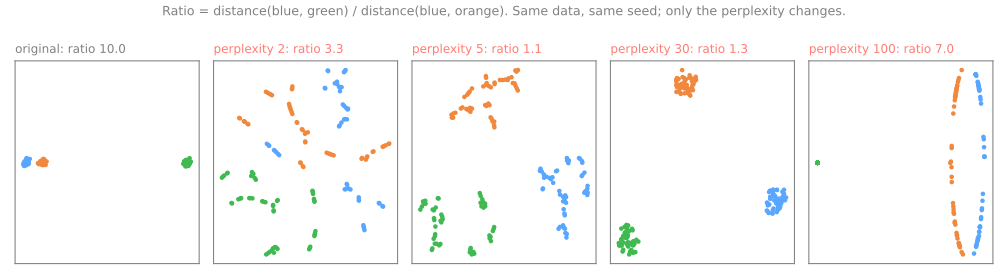
At 2 and 5 every group shatters into fragments that do not exist. There is no "right" perplexity: usually 5–50, smaller than the smallest group you want to see.
UMAP: a graph of neighbors
- Each point is linked to its
n_neighborsnearest points, with fuzzy weights; no point is left isolated. - The weights are merged into one symmetric fuzzy graph.
- A 2-D layout by stochastic gradient descent: edges attract, sampled random points repel; an explicit penalty for putting distant points close.
n_neighbors (15)
the scale at which Euclidean distance is trusted: local detail against global structure
min_dist (0.1)
how tightly points are packed: cosmetic, not structural
transform: fit on 80% of the digits, 96.4% of the new images land next to an image of the same digit.The comparison table
| PCA | t-SNE | UMAP | |
|---|---|---|---|
| nature | linear, deterministic | nonlinear, stochastic | nonlinear, stochastic |
| local structure | weak | very good | very good |
| global structure | best (variance) | weak | moderate |
| group distances / sizes | yes / yes | no / no | partly / no |
transform new data | yes, trivial | no | yes |
| key hyperparameters | \(k\), scaling | perplexity, iterations | n_neighbors, min_dist |
| preprocessing for a model | recommended | not advised | with care, in the pipeline |
Seven forbidden statements about a t-SNE/UMAP plot
- "This group is bigger, so it varies more." (11.6× in the data, 1.0× on the map)
- "These two groups are close, so they are similar." (10× in the data, 1.3× on the map)
- "There are 5 groups in the data." There are 5 blobs on the plot.
- "The horizontal axis represents X." Rotation and reflection are arbitrary.
- "I ran it once and saw this." Vary seed, perplexity, sample.
- "I used the 2 t-SNE components as features." No honest
transform. - "I ran t-SNE on the whole dataset and then split." Leakage.
Choosing a method
- It will feed another model, or you need reversibility → PCA. Full stop.
- You want to look at the data to form hypotheses, up to a few thousand points → t-SNE or UMAP, with PCA first if \(d\) is large.
- \(n\) is large, or you must project new data onto the same map → UMAP.
- You need reliable global structure in one picture → none is ideal: show PCA and t-SNE/UMAP.
Summary
- Many columns hurt only when they carry no structure; ask how many directions actually vary.
- PCA = eigenvectors of the covariance, sorted by eigenvalue; \(\lambda_k\) is the variance along component \(k\).
- Kept and dropped share one budget: explained variance chooses \(k\); the reconstruction error is the sum of the dropped eigenvalues.
- Standardize columns in different units, not pixels; fit PCA inside the pipeline.
- t-SNE and UMAP keep neighbors, nothing else; only PCA and UMAP place new points.
| symptom | what to do |
|---|---|
| PC1 explains 99% and is a single column | standardize, then refit |
| tidy groups on a t-SNE map | validate them in the original space |
| a classifier fed with 2 t-SNE coordinates | PCA (or UMAP) inside the pipeline |
Mapping handwritten zip codes, steps 1 to 4
- USPS (US Postal Service) digits: 9,298 handwritten digits from envelopes, 16×16 = 256 columns; we map a sample of 1,500.
- Download the lab notebook and open it in Jupyter or Colab; in Colab, run
!pip install umap-learnfirst. - Steps: 1. load a sample · 2. how many dimensions? · 3. compression and reconstruction error · 4. three maps of the same images.
- At every step, answer the Predict before running.
- Simulations: standardize the pixels anyway (step 2) and compress images the PCA never saw (step 3).
Pace: step 1 in 5 min; step 2 and the first simulation in 10 min; step 3 and the second in 10 min; step 4 in 5 min.