Three tools, one hidden assumption
permutation importance
shuffle one column, keep the others
partial dependence (PDP)
set one feature to \(v\) in every row, keep the others
SHAP (SHapley Additive exPlanations)
fill the missing features from a background, one by one
All three change a feature while holding the others fixed, whether or not that combination exists.
The path of this part
- Correlated featuresshared credit and impossible rows
- Off the mapa PDP averaged over places that do not exist
- Another local answerLIME, and how wide "local" is
- Estimates, not certificatesthree rankings, choices inside, a checklist
Correlated features (1): shared credit
Add an exact copy of income and refit the random forest. Predict. Each copy's permutation importance falls to 0.196. What does shuffling both together give?
| MDI | perm. on test | |
|---|---|---|
| income alone | 0.516 | 0.754 |
| income | 0.262 | 0.196 |
| income_copy | 0.259 | 0.196 |
| both shuffled together | 0.748 |
MDI: mean decrease in impurity, the importance trees compute on their training splits.
Shuffle one copy and the trees that split on the other still work.
Together the two copies get 0.392, half of what the information is worth.
Correlated features (2): impossible rows
- Latitude and longitude: correlation −0.92, because California is a diagonal strip.
- Shuffle latitude alone: a San Francisco longitude gets a San Diego latitude, a point in the Pacific.
The model never saw such places. Part of the 1.330 measures latitude; part measures how badly the model behaves off the map.
The extrapolation trap
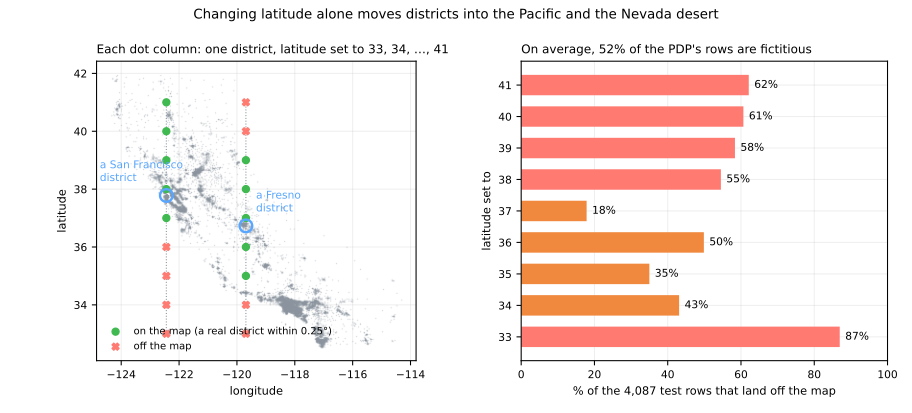
| latitude set to | 33° | 35° | 37° | 39° | 41° |
|---|---|---|---|---|---|
| rows off the map | 87% | 35% | 18% | 58% | 62% |
LIME: a linear model around one row
- perturb: thousands of points around the row
- predict: ask the black box about each
- weight: the closer, the heavier (kernel width \(w\))
- fit a weighted linear model
| San Francisco | by hand | lime |
|---|---|---|
| income | 42.1 | 42.0 |
| occupancy | −49.9 | −48.9 |
| latitude | −89.3 | −91.8 |
| longitude | −53.6 | −55.5 |
LIME: Local Interpretable Model-agnostic Explanations (Ribeiro, Singh & Guestrin, 2016). The coefficients are slopes, in $1,000 per standard deviation.
SHAP or LIME? They answer different questions
SHAP
how much does this district's actual income move its prediction away from the average? Its income is close to average: not much.
"why is this house expensive?"
LIME
what would happen if income changed? The local slope, which is steep.
"what would change the price?"
KernelSHAP is LIME run on coalitions, with one particular kernel and no regularization: that choice makes the regression return Shapley values.
How local is "local"?
| width | 0.5 | 1.0 | 2.12 | 5.0 | std, 5 seeds |
|---|---|---|---|---|---|
| income | 54.7 | 54.8 | 42.1 | 38.2 | 1.5 |
| house_age | −9.9 | 1.3 | 1.3 | 1.0 | 1.3 |
| occupancy | −71.0 | −67.4 | −49.9 | −45.0 | 0.9 |
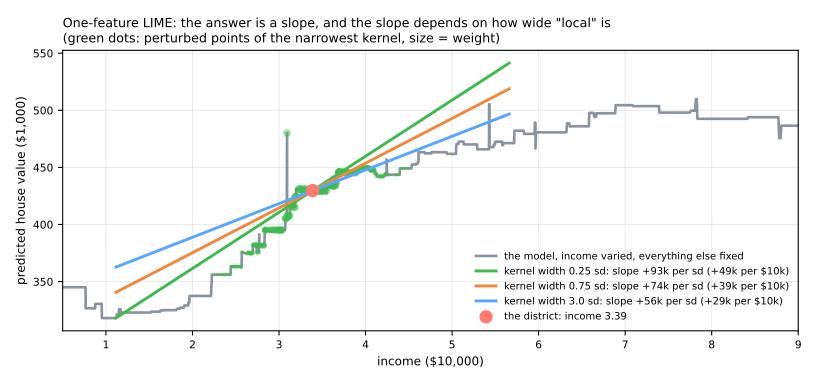
house_age even changes sign. The default \(0.75\sqrt{d} = 2.12\), with \(d = 8\) features, is a convention, not a law.Three rankings, three questions
MDI
income first (0.567)
what did training use?
permutation
latitude first, a drop larger than 1, inflated by impossible rows
what does the score need?
mean |SHAP|
latitude first, 76.6 against 44.2 for income, in $1,000
how far does each feature move the predictions?
Explanations are estimates, with choices inside
choices measured in this lesson
- the background sets SHAP's base value
- the kernel width changes LIME's slopes
- correlated features split their credit arbitrarily
- permutation and PDP query impossible rows
they can even be gamed
Slack et al. (2020) built models that discriminate on real inputs while showing innocent explanations to LIME and SHAP, which probe them with off-distribution points.
A checklist for explaining a model
- Try an interpretable model first; if it is as good on the same folds, use it.
- Compute importances on held-out data.
- Find correlated groups and permute or explain them together.
- Look at ICE curves, not only the PDP; check that the plotted values are inside the data.
- Use SHAP for local explanations; state the background you used.
- When a feature dominates, ask when is this value recorded? (leakage).
- Never read an explanation as a causal claim.
A protected attribute and a planted leak, steps 8 and 9
- Same notebook, same session: continue from step 8 (if the session dropped, run steps 1 to 7 first).
- Step 8: does the forest need
personal_status? Retrain without it and compare the AUC (area under the receiver operating characteristic curve); then ask how many applicants it moves. - Step 9: plant a leak (collection letters, sent after a loan goes bad) and watch whether cross-validation or the explanations catch it.
- Simulations: whom does
personal_statuspush up? (step 8) and a subtler leak (step 9). - Lab notebook, for Jupyter or Colab.
Pace: step 8 and its simulation in 12 min; step 9 and its simulation in 13 min.