From one partition to a tree
k-means
needs \(k\) before it starts; returns one flat partition
hierarchical
builds all the groupings at once, nested, as a tree: the dendrogram. \(k\) is chosen afterwards, by cutting it.
The path of this part
- Build the treemerge the closest pair; four linkages by hand
- Read the treeheights, not leaf order; the matrix Z
- Cut ita horizontal line; the gaps and the silhouette
- Check ithow faithfully the heights keep the distances
The idea: merge the two closest groups, repeat
- start with \(n\) clusters, one per point;
- find the two clusters closest to each other;
- merge them, and record the distance: the merge height;
- repeat until one cluster is left.
After \(n - 1\) merges, the history of the merges is the tree. Nothing random, nothing iterated to convergence: the same data always gives the same tree (up to ties).
The linkage: distance between clusters
| linkage | distance between \(P\) and \(Q\) | tends to produce |
|---|---|---|
| single | the closest pair | chains; one bridge merges two groups |
| complete | the farthest pair | compact groups of similar diameter |
| average | the mean of all cross distances | a compromise |
| Ward | how much the merge raises the within-cluster sum of squares | round groups of similar size, like k-means |
The within-cluster sum of squares is the k-means inertia: Ward grows it as slowly as it can, one greedy merge at a time.
Simulator: merge, watch the tree grow, cut it
Predict. On the chain (two blobs and a bridge), which linkage will glue the two blobs together long before the last merge?
Five points, four linkages, step by step
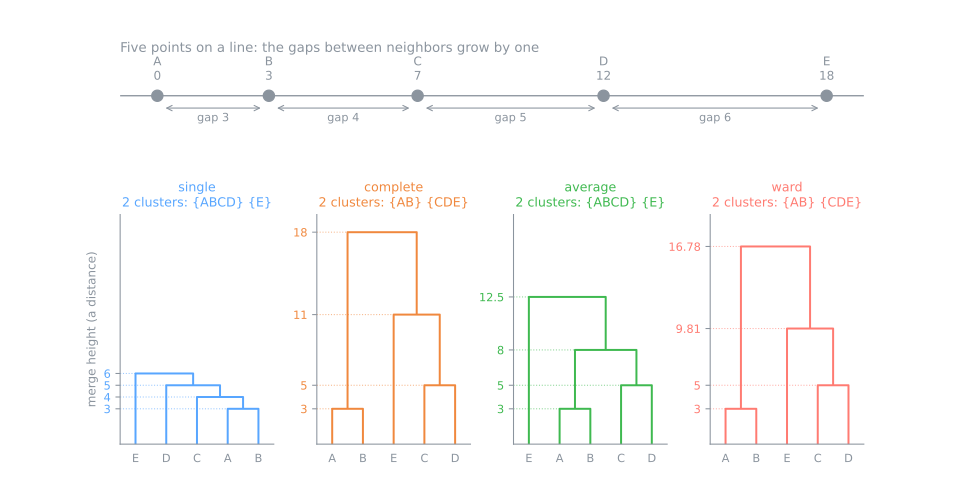
A = 0, B = 3, C = 7, D = 12, E = 18 on a line: the gaps grow by one. Predict. After A + B, which merge comes next for each linkage? Then step through and switch the linkage.
One matrix, different trees
Reading a dendrogram
- The y-axis is a distance. Two points are as similar as the height of the lowest bar that joins them: the cophenetic distance. Complete tree: A and B at 3, A and E at 18.
- Long vertical lines are the interesting part: a group that stays far from everything. {C, D, E} forms at 11 and waits until 18.
- The left-to-right order carries almost no information: each bar can flip, so 5 leaves have \(2^4 = 16\) equivalent drawings.
The linkage matrix Z
Z = linkage(X, 'complete')
# [[ 0.  1.  3.  2.]
#  [ 2.  3.  5.  2.]
#  [ 4.  6. 11.  3.]
#  [ 5.  7. 18.  5.]]
| column | meaning |
|---|---|
| 0, 1 | the two clusters merged; ids 0 to \(n-1\) are points, row \(i\) creates cluster \(n + i\) |
| 2 | the merge height: 3, 5, 11, 18 |
| 3 | how many points the new cluster has: 2, 2, 3, 5 |
One row per merge, \(n - 1\) rows, in the order the merges happened.
Cutting the tree
A horizontal line at height \(t\): each piece hanging below it is one cluster.
| cut at | clusters |
|---|---|
| 4 | {A, B}, {C}, {D}, {E} |
| 8 | {A, B}, {C, D}, {E} |
| 12 | {A, B}, {C, D, E} |
| 20 | everything |
Any cut between 11 and 18 gives the same two clusters: a range 7 units wide. That width is what makes the two-cluster answer stable here.
In scikit-learn, and one property
AgglomerativeClustering(n_clusters=2, linkage='ward').fit(X)
AgglomerativeClustering(n_clusters=None, distance_threshold=8, linkage='complete').fit(X)
- The same merge heights as the hand tables (Ward on the \(\sqrt{2\Delta}\) scale).
- No
predict: a new point has no place in the tree until you rebuild it or assign it with another rule.
Choosing where to cut
400 points in four blobs that come in two pairs: two scales of structure. Ward tree.
| \(k\) | range of cut heights | gap | silhouette |
|---|---|---|---|
| 2 | 32.3 to 159.2 | 126.9 | 0.787 |
| 3 | 30.3 to 32.3 | 2.1 | 0.664 |
| 4 | 9.7 to 30.3 | 20.6 | 0.545 |
| 5 | 9.2 to 9.7 | 0.5 | 0.473 |
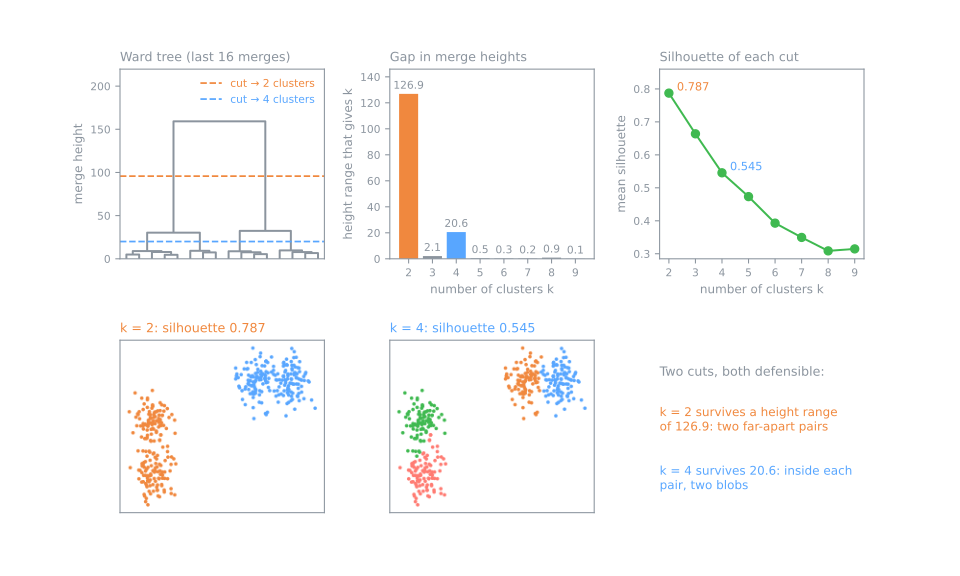
The wider the range of heights a \(k\) survives, the more the data insist on it. The silhouette prefers the coarsest split and does not see the second scale.
So which cut is right?
- Both: the cuts are nested. Report two segments at the coarse level and four at the fine level; they agree.
- When one number is required, choose with the question in mind (how many groups can someone act on?) and use the gaps and the silhouette to rule out cuts the data do not support: \(k = 3\), gap 2.1.
Cophenetic correlation, pair by pair
\(d\) = original distance of a pair; \(c\) = its cophenetic distance, the height where the two points first join. The cophenetic correlation is the correlation between \(d\) and \(c\) over the 10 pairs. Predict. Does the chain-shaped single tree keep the distances better or worse than the complete tree?
Faithful tree ≠ good clusters
The four blobs of the previous slides, four linkages. ARI (adjusted Rand index): 1 = the true groups, about 0 = chance.
| cophenetic correlation | ARI at \(k = 4\) | |
|---|---|---|
| single | 0.944 | 0.496 |
| complete | 0.947 | 0.954 |
| average | 0.953 | 0.856 |
| Ward | 0.952 | 0.892 |
Summary
- Merge the two closest clusters, repeat: the history of the merges is the tree.
- The linkage defines "closest" and decides what the tree finds: one matrix, three trees.
- Read heights, not the left-to-right order: two points are as similar as the bar where they meet.
- A cut is a partition, and the cuts of one tree are nested; the widest range of heights points to \(k\).
- Cophenetic correlation = how faithful the tree is to the distances, not how good the clusters are.
| symptom | what to do |
|---|---|
| every \(k\) survives only a narrow range of heights | report the tree; do not force one \(k\) |
| two cuts, both with wide gaps | keep both levels: they are nested |
A tree of 101 animals, steps 1 to 6
- The UCI (University of California, Irvine) Zoo table: 15 yes/no questions and the number of legs. The zoologists' class stays sealed until step 8, in the advanced part.
- Scale the columns, build four trees and keep the most faithful, draw it, choose the cut and name the clusters.
- Download the lab notebook and open it in Jupyter or Colab.
- At every step, answer the Predict before running.
- Simulations: the tree without scaling (step 2) and a new animal, without
predict(step 6).
Pace: steps 1 and 2 and the first simulation in 10 min; steps 3 to 5 in 10 min; step 6 and the second simulation in 10 min.