The oldest algorithm in the course
Legendre
publishes least squares to fit comet orbits
Gauss
claims he had used it since then
Galton
studies human height, and the word regression appears
The path of this part
- Galton's puzzleregression to the mean; the slope is the correlation
- The modelŷ = Xw; reading the coefficients; why not invert X
- Least squaresminimize the squared residuals; the formulas by hand
- Residualsresidual plots; outliers and leverage
- Measuring qualityMAE, MSE, RMSE and R²
Galton's puzzle
- Heights of 928 adult children and their parents.
- He was looking for the strength of heredity.
The children come back toward the mean
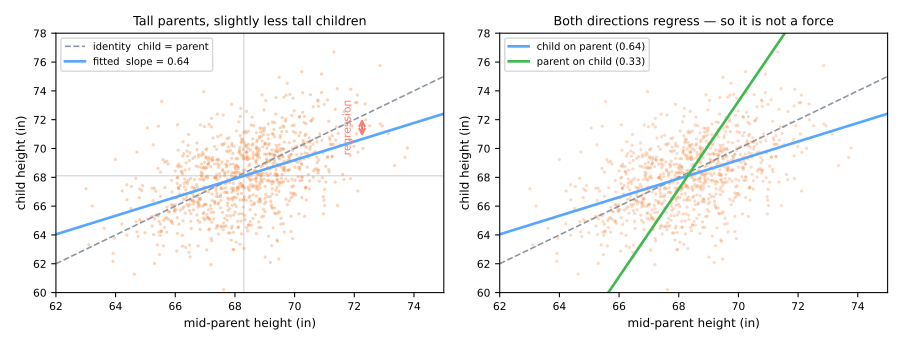
Dashed line: identity (the child equals the parent). The fitted line is flatter: 3 inches above the mean in the parents → only about 2 in the child.
The slope is the correlation, with units
\[ \hat{w}_1 = r_{xy}\,\frac{s_y}{s_x} = 0.46 \times \frac{2.52}{1.80} \approx 0.64 \]\(r_{xy}\): correlation between mid-parent \(x\) and child \(y\); \(s_x, s_y\): their standard deviations, in inches.
correlation \(r\)
no units; how tightly the points follow a line
slope \(\hat w_1\)
units of \(y\) per unit of \(x\); the same as \(r\) only when \(s_x = s_y\)
Simulator: regression to the mean
Both variables have the same spread here, so the slope is the correlation. Lower the correlation and watch the line flatten.
Regression to the mean is not a force
- Regress parent on child: that line is flatter too. Children cannot pull their parents toward the mean.
- It is arithmetic: a measurement is signal + noise. An extreme value had help from luck; the signal comes back, the luck does not.
tutoring
the worst students improve — they would have anyway
the magazine jinx
an exceptional season is followed by a normal one
the clinic
part of the drop in pressure is regression; only a control group separates it
The model
\[ \hat{y} = w_0 + w_1 x_1 + w_2 x_2 + \dots + w_d x_d \qquad\text{or}\qquad \hat y = Xw \]- \(x_j\): the \(d\) features; \(w_j\): change in \(\hat{y}\) per unit of \(x_j\), holding the other features fixed.
- \(w_0\): the prediction when every feature is zero (a column of 1s in \(X\), one row per example).
Reading the coefficients
\[ \widehat{\text{price}} = 50000 + 3200\cdot\text{area} - 1500\cdot\text{age} \]3200: among apartments of the same age, one extra m² goes with R$ 3200 more.- It is not "bigger apartments cost 3200 more per m²": if newer buildings are larger, the raw relation mixes both effects.
Predict. \(\hat y = Xw\) looks like a linear system. Why not just compute \(w = X^{-1}y\)?
Why not just invert \(X\)?
Three points \((x, y)\): (1, 2), (2, 3), (3, 7). Column 1 of \(X\) is the 1s, column 2 is \(x\).
- \(X\) is not square (\(3 \times 2\)): it has no inverse.
- There is no exact solution anyway: 3 equations, 2 unknowns.
What we do instead: the closest reachable point
Minimize \(\lVert y - Xw\rVert^2\), the sum of squared residuals. Setting its gradient to zero gives the normal equations:
\[ X^\top X\,w = X^\top y \;\Rightarrow\; \begin{cases} 3w_0 + 6w_1 = 12 \\ 6w_0 + 14w_1 = 29 \end{cases} \] \[ w_0 = -1,\quad w_1 = 2.5 \]Fitted 1.5, 4, 6.5; residuals 0.5, −1, 0.5; \(\lVert e\rVert^2 = 1.5\), the smallest possible.
\(\hat y = -1 + 2.5x\) (green) and the residuals (orange)
Your instinct is the special case
Keep only two points, (1, 2) and (2, 3): two equations, two unknowns.
\[ X = \begin{pmatrix} 1 & 1 \\ 1 & 2 \end{pmatrix}, \quad X^{-1} = \begin{pmatrix} 2 & -1 \\ -1 & 1 \end{pmatrix}, \quad w = X^{-1}y = \begin{pmatrix} 1 \\ 1 \end{pmatrix} \]Least squares gives the same answer: \((X^\top X)^{-1}X^\top = X^{-1}\).
\(\hat y = 1 + x\): a line through two points, no residual
Least squares: which line?
\[ J(w) = \sum_{i=1}^{n} (y_i - \hat{y}_i)^2 = \lVert y - Xw \rVert^2 \]why vertical?
the job is to predict \(y\): an error is measured along \(y\). Perpendicular distances are PCA (principal component analysis), another question.
why squared?
- smooth: there is a closed form
- one big error costs more than several small
- Gaussian noise → maximum likelihood
Simulator: drag the points
Predict. Drag one point far from the rest. Does the line move a little or a lot?
The exact solution, for one feature
\[ \hat{w}_1 = \frac{\sum_i (x_i - \bar{x})(y_i - \bar{y})}{\sum_i (x_i - \bar{x})^2} = r_{xy}\frac{s_y}{s_x}, \qquad \hat{w}_0 = \bar{y} - \hat{w}_1 \bar{x} \]\(\bar x, \bar y\): the means of \(x\) and \(y\). The numerator adds, point by point, how far \(x\) and \(y\) are from their means, multiplied; the denominator, the squared distances of \(x\).
Least squares by hand, step by step
Predict. Five points: (1, 2), (2, 4), (3, 5), (4, 4), (5, 6). Which point adds nothing to the slope? Then step through the table, the slope, the intercept and the residuals.
In scikit-learn
from sklearn.linear_model import LinearRegression

model = LinearRegression().fit(X_train, y_train)
model.coef_, model.intercept_
y_pred = model.predict(X_test)
Residuals: what the model failed to explain

The residual plot: \(e_i = y_i - \hat y_i\) against \(\hat y_i\).
A healthy one looks like nothing at all: a band around zero.
Any pattern says which assumption broke.
Simulator: diagnose before reading the verdict
Predict. For each dataset, look only at the residual plot and decide: fine, curve, funnel or a dangerous point?
Reading a residual plot
| what you see | what it means | what to do |
|---|---|---|
| structureless band | the linear form fits | nothing |
| U or ∩ curve | a nonlinear relationship | polynomial terms, or transform \(x\) |
| funnel | heteroscedasticity: noise grows with \(\hat y\) | transform \(y\) (often log) |
| isolated extreme point | outlier or high leverage | investigate it; never delete it silently |
| waves over the index | correlated errors (time) | a time-series model |
Four ways to summarize the residuals
| metric | formula | units |
|---|---|---|
| MAE | \(\frac{1}{n}\sum \lvert e_i \rvert\) | of \(y\) |
| MSE | \(\frac{1}{n}\sum e_i^2\) | \(y\) squared |
| RMSE | \(\sqrt{\text{MSE}}\) | of \(y\) |
| R² | \(1 - \frac{\sum e_i^2}{\sum (y_i - \bar{y})^2}\) | none |
The name is the recipe, read right to left:
RMSE = Error → Squared → Mean → Root.
Mean Absolute Error, Mean Squared Error, Root Mean Squared Error, coefficient of determination.
On the five points
\(\hat y = 1.8 + 0.8x\) and its five residuals
\(\text{MAE} = \frac{0.6+0.6+0.8+1.0+0.2}{5} = \frac{3.2}{5} = \mathbf{0.64}\)
\(\text{MSE} = \frac{0.36+0.36+0.64+1.00+0.04}{5} = \frac{2.40}{5} = \mathbf{0.48}\)
in squared units of \(y\)
\(\text{RMSE} = \sqrt{0.48} = \mathbf{0.69}\)
MAE or RMSE?
| errors | MAE | RMSE | |
|---|---|---|---|
| Model A | 2, 2, 2, 2, 2 | 2.0 | 2.0 |
| Model B | 0, 0, 0, 0, 10 | 2.0 | 4.47 |
RMSE squares before averaging: the single 10 contributes 100, and \(\sqrt{100/5} = 4.47\). Neither metric is right in the abstract: choose the one your problem's costs call for, before looking at the results.
R²: against the laziest model
\[ R^2 = 1 - \frac{\text{SSE}}{\text{SST}}, \qquad \text{SSE} = \sum (y_i - \hat y_i)^2, \quad \text{SST} = \sum (y_i - \bar y)^2 \]- SST (total sum of squares): the error of always predicting \(\bar y\). SSE (sum of squared errors): what the line still gets wrong.
- Five points: \(R^2 = 1 - 2.40/8.80 = 0.727\), and \(r = 0.853\), \(0.853^2 = 0.727\).
DummyRegressor), and evaluate on held-out data.Summary
- Regression to the mean is arithmetic, not a force: the slope is \(r_{xy}\,s_y/s_x\).
- A coefficient is the effect of its feature with the others fixed; it is not an importance.
- \(X\) cannot be inverted; least squares takes the reachable point closest to \(y\): \(X^\top X w = X^\top y\). The line passes through \((\bar x, \bar y)\).
- The residuals sum to zero and are orthogonal to the features; plot them.
- MAE, RMSE, R²: different summaries of the same residuals, meaningful on held-out data.
Five points, from scratch: steps 1 to 4
- Only NumPy: the matrix form, the inverse that fails, the normal equations, the residuals.
- The same five points as the hand calculation: every output can be checked on paper.
- Notebook on Colab (in Portuguese), sections 1 to 4: nothing to download. Save a copy to your Drive.
- At every step, answer the Predict before running.
- Simulations: your instinct, the special case (step 3) and the point that turns the line (step 4).
Pace: steps 1 and 2 in 5 min; step 3 and the first simulation in 10 min; step 4 and the second in 15 min.