The path of this part
- Why cross-entropythe price, the push and the shape of the loss
- Curved boundariessquared and polynomial features
- Many classessoftmax, on wine
- Use it wellstrengths, weaknesses, traps
Why not squared error?
\((y - \hat p)^2\) is also small when the predicted probability \(\hat p\) is right and large when it is wrong. Predict. Combined with the sigmoid, what could go wrong?
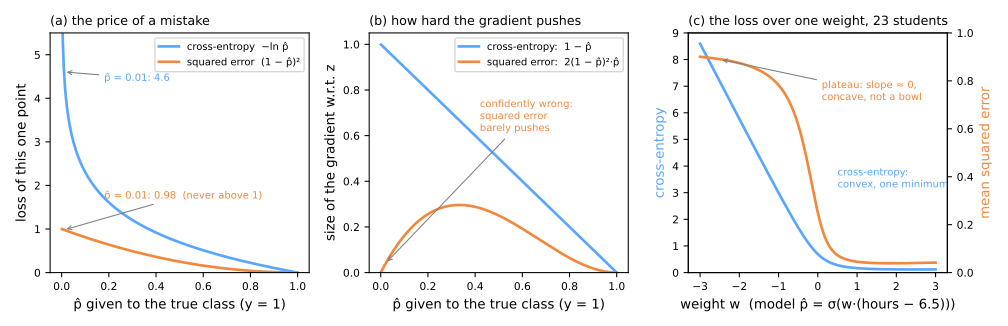
(a) the price
squared error never exceeds 1: \(\hat p = 0.1\) and \(0.001\) cost 0.810 and 0.998; cross-entropy, 2.303 and 6.908
(b) the push
the worse the mistake, the weaker the squared-error gradient
(c) the shape
cross-entropy is convex; squared error has a plateau
(b) The push of the gradient
\(L\): the loss of one example of class 1 (\(y = 1\)). Gradient descent fixes it by moving its score \(z\); the strength is, by the chain rule, \(\partial L/\partial z = \partial L/\partial \hat p \cdot \hat p(1-\hat p)\), where \(\hat p(1-\hat p)\) is the slope of the sigmoid:
\[ \text{squared error: } -2(1-\hat p)\cdot\hat p(1-\hat p) \qquad \text{cross-entropy: } -\tfrac{1}{\hat p}\cdot\hat p(1-\hat p) = \hat p - y \]| \(\hat p\) given to the true class | sigmoid slope | squared error | cross-entropy |
|---|---|---|---|
| 0.5 | 0.25 | −0.250 | −0.500 |
| 0.1 | 0.09 | −0.162 | −0.900 |
| 0.01 | 0.0099 | −0.0196 | −0.990 |
| 0.001 | 0.001 | −0.0020 | −0.999 |
(c) The shape of the loss
One weight, \(\hat p = \sigma(w\,(\text{hours} - 6.5))\), on the 23 students: average loss over all of them. \(w < 0\) bets that whoever studies more fails.
| \(w\) | −3 | −1 | 0 | +1 | +3 |
|---|---|---|---|---|---|
| squared error | 0.900 | 0.782 | 0.250 | 0.045 | 0.042 |
| cross-entropy | 8.597 | 2.992 | 0.693 | 0.166 | 0.118 |
Simulator: the two losses side by side
Predict. Turn \(w\) the wrong way. Which loss notices that something is badly wrong?
Curved boundaries: engineer the features
The circles: one class inside, the other around it. Any line leaves pieces of the outer circle on both sides.
| features | test accuracy |
|---|---|
| \(x_1, x_2\) | 0.400 |
| \(x_1^2, x_2^2\) | 1.000 |
\(w = (-16.83, -16.00)\), \(b = 9.70\): a circle of radius \(\sqrt{9.70/16.4} \approx 0.77\), between the inner circle (0.5) and the outer one (1).
When the shape is not obvious
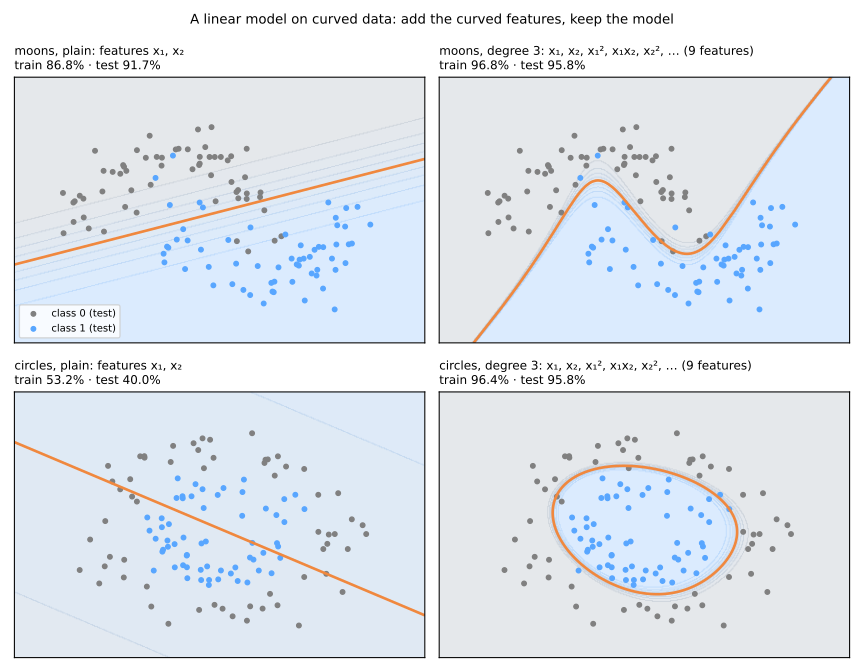
PolynomialFeatures(degree=3): 9 features; moons 0.917 → 0.958, circles 0.400 → 0.958.- On the circles, the 2 right features (100%) beat 9 generic ones: knowing the shape wins.
- Prices: coefficients lose their reading, and more features overfit more. Scale after expanding.
Multi-class: softmax
\(k\) classes, one score per class, \(z_c = w_c^\top x + b_c\); the softmax turns them into probabilities that sum to 1:
\[ \hat{p}_c = \frac{e^{z_c}}{\sum_{j=1}^{k} e^{z_j}} \]| class | \(z_c\) | \(e^{z_c}\) | \(\hat p_c = e^{z_c}/11.212\) |
|---|---|---|---|
| A | 2.0 | 7.389 | 0.659 |
| B | 1.0 | 2.718 | 0.242 |
| C | 0.1 | 1.105 | 0.099 |
| sum | 11.212 | 1.000 |
- One weight vector and one intercept per class.
- A gap of 1 in score is a factor \(e \approx 2.7\) in probability.
- With two classes, softmax is the sigmoid: \(\sigma(z_1 - z_0)\).
On wine: a near tie
178 wines, 3 cultivars; two features, alcohol and flavanoids.
| wine | true cultivar | scores | probabilities | predict |
|---|---|---|---|---|
| 0 | 0 | 6.47, −0.22, −6.25 | 0.999, 0.001, 0 | 0 |
| 100 | 1 | −0.29, 5.32, −5.02 | 0.004, 0.996, 0 | 1 |
| 133 | 2 | −3.11, 1.56, 1.55 | 0.005, 0.502, 0.493 | 1 ✗ |
Practical profile
strengths
- fast; convex: the same answer every time
- reasonable probabilities
- interpretable through odds ratios
- a strong baseline
weaknesses
- linear boundary
- interactions added by hand
- slow on unscaled features
- correlated coefficients unstable to read
max_iter warnings usually mean unscaled features. One-hot columns for every category next to an intercept leave single coefficients meaningless: drop a reference category. Odds ratios are not probability ratios.Summary
- Squared error with a sigmoid caps the price of a mistake, kills the push on the worst ones and has plateaus; cross-entropy is convex.
- The model is linear in its features: squared or polynomial features draw curved boundaries.
- Knowing the shape beats generating many features; scale after expanding.
- Softmax: one score per class, probabilities that sum to 1; with two classes it is the sigmoid.
- Reach for it when you need a solid, explainable baseline with probabilities worth thresholding.
Odds ratios, and the one test, steps 7 and 8
- Same notebook, same session: the steps use
model,w,names,passengers,dummyand the train and test sets. - Read every coefficient as an odds ratio against its reference category; then touch the test set once, and move the threshold on the training rows.
- Notebook on Colab (in Portuguese), from step 7.
- Simulations: the odds ratio is the same for everyone (step 7) and moving the threshold (step 8).
Pace: step 7 and its simulation in 12 min; step 8 and its simulation in 10 min.