From numbers to categories
| classes | examples | |
|---|---|---|
| binary | 2, coded 0 and 1 | pass/fail, fraud/legit, malignant/benign, survived/died |
| multiclass | \(k > 2\) | iris species, digit 0–9, product category |
step 1: a probability
"this passenger survives with probability 0.94"
step 2: a threshold
"0.94 ≥ 0.5, so: survived"
The path of this part
- Why not a linea straight line fails at classifying
- Score → probabilitythe sigmoid; the decision boundary is a line
- Read the oddsa coefficient multiplies the odds
- Loss & trainingcross-entropy; gradient descent, one iteration by hand
- Probability → labelthe threshold is a choice
Why not a straight line?
23 students, hours of study, pass (1) or fail (0). Fit a linear regression and call "pass" anything above 0.5.
Then add five students who studied 25 to 45 hours, and passed, as anyone would expect.
Correct points hurt the line
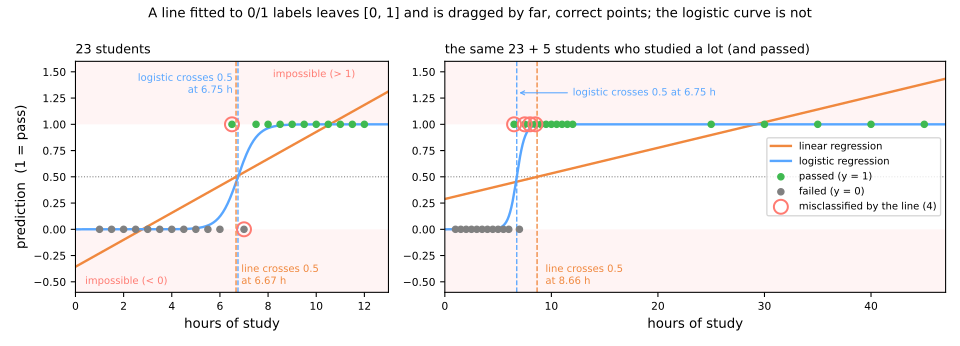
| line: outputs | line: crosses 0.5 | line: errors | logistic: crosses 0.5 | logistic: errors | |
|---|---|---|---|---|---|
| 23 students | −0.23 to 1.18 | 6.67 h | 2 | 6.75 h | 2 |
| + 5 far passers | 0.31 to 1.39 | 8.66 h | 4 | 6.75 h | 2 |
Two problems, one cure
the line leaves [0, 1]
−0.23 for one hour, 1.18 for twelve: not probabilities, so "how sure is the model?" has no answer
correct points pull it
least squares wants the line near the far students: it flattens and the errors go from 2 to 4, caused by data that agreed with the model
From line to probability
Keep the linear score (\(w\): weights, \(x\): features, \(b\): intercept):
\[ z = w^\top x + b \]and squash it with the sigmoid into the predicted probability \(\hat p\) of class 1:
\[ \hat{p} = \sigma(z) = \frac{1}{1 + e^{-z}} \]three values to memorize
- \(\sigma(0) = 0.5\)
- large positive \(z\) → \(\hat p \to 1\)
- large negative \(z\) → \(\hat p \to 0\)
class 1 when \(\hat p \ge 0.5\), the same as \(z \ge 0\)
By hand: three new students
Fitted on the 23 students: \(w = 2.619\) per hour, \(b = -17.681\). Predict. Who passes: 4, 6 or 7.5 hours?
| hours \(x\) | \(z = 2.619x - 17.681\) | \(e^{-z}\) | \(\hat p = 1/(1+e^{-z})\) | class |
|---|---|---|---|---|
| 4 | −7.205 | 1346 | 0.001 | 0 (fail) |
| 6 | −1.967 | 7.149 | 0.123 | 0 (fail) |
| 7.5 | 1.962 | 0.1406 | 0.877 | 1 (pass) |

The steepest point, \(\hat p = 0.5\), is at \(-b/w = 6.75\) hours; a larger \(w\) makes a sharper transition. predict_proba is literally sigmoid(decision_function).
The decision boundary is a line
Two features: \(z = w_1x_1 + w_2x_2 + b\). Where \(z = 0\) (probability 0.5) is a straight line: a linear classifier.
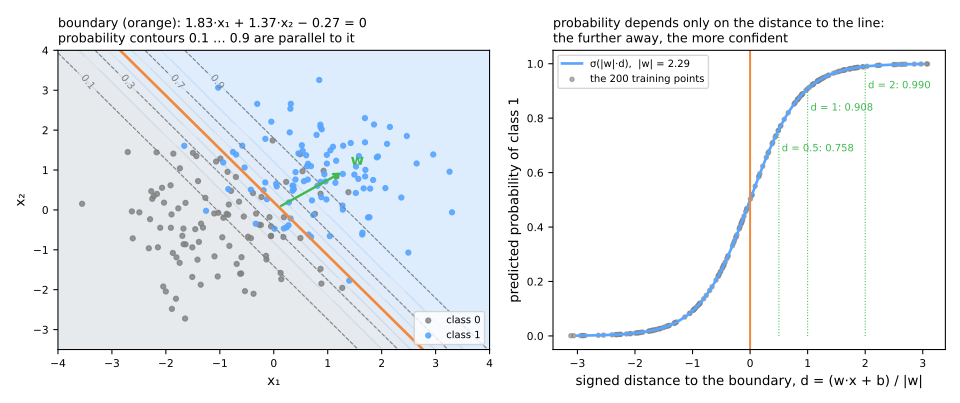
200 points: \(w = (1.832, 1.371)\), \(b = -0.266\), \(\lVert w\rVert = 2.288\).
Probability depends only on the distance to the line
Walk away from the boundary along \(w\), from two different starting points of it; \(d\) is the signed distance to the line:
| signed distance \(d\) | −1 | 0 | 0.5 | 1 | 2 |
|---|---|---|---|---|---|
| \(\hat p\), from either start | 0.092 | 0.5 | 0.758 | 0.908 | 0.99 |
- \(w\) is perpendicular to the boundary and points toward class 1.
- Equal-probability contours are lines parallel to the boundary.
- \(\lVert w\rVert = 2.29\): one unit from the line, the model is already 90.8% sure.
Odds: the language of betting
| probability \(p\) | odds \(p/(1-p)\) | in words |
|---|---|---|
| 0.75 | 3 | "3 to 1": out of 4 cases, 3 for and 1 against |
| 0.5 | 1 | "1 to 1": even |
| 0.2 | 0.25 | "1 to 4": out of 5 cases, 1 for and 4 against |
One extra unit multiplies the odds
A model with \(w = 0.8\), \(b = -4\):
| \(x\) | \(z = 0.8x - 4\) | \(\hat p = \sigma(z)\) | odds | \(e^{z}\) |
|---|---|---|---|---|
| 4 | −0.8 | 0.310 | 0.449 | 0.449 |
| 5 | 0.0 | 0.500 | 1.000 | 1.000 |
| 6 | +0.8 | 0.690 | 2.226 | 2.226 |
On the hours model
\(e^{w} = e^{2.619} = 13.727\)
| hours | \(\hat p\) | odds |
|---|---|---|
| 5 | 0.01 | 0.01 |
| 6 | 0.123 | 0.14 |
| 7 | 0.658 | 1.925 |
Each extra hour multiplies the odds of passing by 13.7.
In probability: +11 points from 5 to 6 hours, +54 points from 6 to 7.
The loss: cross-entropy
Maximum likelihood: make the labels we observed as probable as possible. Multiply over the \(n\) examples, take logs and flip the sign:
\[ J(w, b) = -\frac{1}{n} \sum_{i=1}^{n} \Big[ y_i \log \hat{p}_i + (1 - y_i) \log (1 - \hat{p}_i) \Big] \]By hand: four predictions
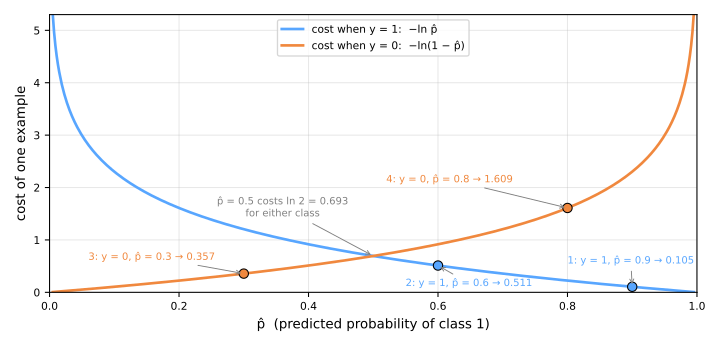
Predict. Which of the four costs the most?
| \(i\) | \(y\) | \(\hat p\) | given to the truth | \(-\ln(\cdot)\) |
|---|---|---|---|---|
| 1 | 1 | 0.9 | 0.9 | 0.105 |
| 2 | 1 | 0.6 | 0.6 | 0.511 |
| 3 | 0 | 0.3 | 0.7 | 0.357 |
| 4 | 0 | 0.8 | 0.2 | 1.609 |
Mean: \((0.105 + 0.511 + 0.357 + 1.609)/4 = 0.646\). The confident mistake (point 4) is 62% of the total.
Training by gradient descent
For one example, the chain rule through \(\hat p = \sigma(z)\), with \(\sigma'(z) = \hat p(1-\hat p)\), gives \(\partial L/\partial z = \hat p - y\). Averaged over the \(n\) rows of the feature matrix \(X\):
\[ \nabla_w J = \frac{1}{n} X^\top (\hat{p} - y), \qquad \frac{\partial J}{\partial b} = \frac{1}{n}\sum_i (\hat p_i - y_i) \]The same shape as linear regression's gradient, with \(\hat p = \sigma(Xw + b)\) in place of \(Xw\).
- forward: \(\hat p = \sigma(Xw + b)\)
- loss: the cross-entropy \(J\)
- backward: the gradients
- update: \(w \leftarrow w - \eta\,\nabla_w J\), \(b \leftarrow b - \eta\,\partial J/\partial b\), with learning rate \(\eta\)
One iteration, by hand
Four of the 23 students (4 h fail, 6.5 h pass, 7 h fail, 9 h pass), guess \(w = 1\), \(b = -5\), \(\eta = 0.1\). Predict. Which student pushes the curve the hardest, and which way?
On 200 points: the same bottom as scikit-learn
The same four stages, 2,000 times, on the 200 points of the boundary slide, with \(\eta = 0.5\) and zero weights at the start:
| iteration | loss |
|---|---|
| 0 | 0.6931 |
| 10 | 0.3391 |
| 100 | 0.2956 |
| 1000 | 0.2955 |
From probabilities to labels: the threshold
| threshold | class 1 predicted | missed class 1 | false alarms | accuracy |
|---|---|---|---|---|
| 0.2 | 131 | 1 | 32 | 0.835 |
| 0.5 | 97 | 12 | 9 | 0.895 |
| 0.8 | 76 | 31 | 7 | 0.810 |
Summary
- \(\hat p = \sigma(w^\top x + b)\): a linear score squashed into (0, 1); the boundary is a line.
- \(e^{w_j}\) multiplies the odds per unit of \(x_j\); the change in probability depends on where you start.
- Cross-entropy: minus the log of the probability given to the truth.
- Gradient descent: forward, loss, backward (\(\hat p - y\)), update; it starts at \(\ln 2\).
- The threshold is a choice: moving it trades one mistake for the other.
Who survived the Titanic? Steps 1 to 6
- 891 passengers, seven raw columns: a pipeline with imputation, one-hot encoding and scaling, then probabilities, and one passenger opened by hand.
- Notebook on Colab (in Portuguese): nothing to download. Save a copy to your Drive.
- At every step, answer the Predict before running.
- Simulations: the effect of age (step 5) and one feature at a time (step 6).
Pace: steps 1 to 4 in 20 min; steps 5 and 6, with their simulations, in 15 min.