The path of this part
- Frame the problemtarget, moment, metric, baseline
- No model wins everywherethe expected loss; no free lunch
- Bias in the dataa model learns the past; proxies
- Feedback loopsa model that decides what it will see
A wish is not a problem
"Reduce the number of patients who miss their appointments."
Four questions before touching the data
| question | what it fixes | the clinic |
|---|---|---|
| target | what is predicted, and so the task | missed the appointment: yes or no (classification) |
| moment | when, and so which features are allowed | 48 h before: age, past absences, days since booking; not a cancellation call made the day before |
| metric | success, in the terms of whoever pays for errors | an empty slot vs one phone call: absences caught with the calls the staff can make |
| baseline | what the simplest answer scores | "nobody misses"; in regression, the training mean |
The goal, written down
\[ \text{minimize } \underbrace{\mathbb{E}_{(x,y)\sim \mathcal{D}}\big[L\big(f(x),\,y\big)\big]}_{\text{expected loss on new data}} \quad \text{while only observing a finite sample} \]- \(f\): the model. \((x, y)\): a new example, drawn from \(\mathcal{D}\), the distribution of the data the model will meet (in the lab, the function
draw). - \(L\): the loss, the price of one wrong answer (in the lab, the squared error \((y - f(x))^2\)). \(\mathbb{E}\): the average over all new examples.
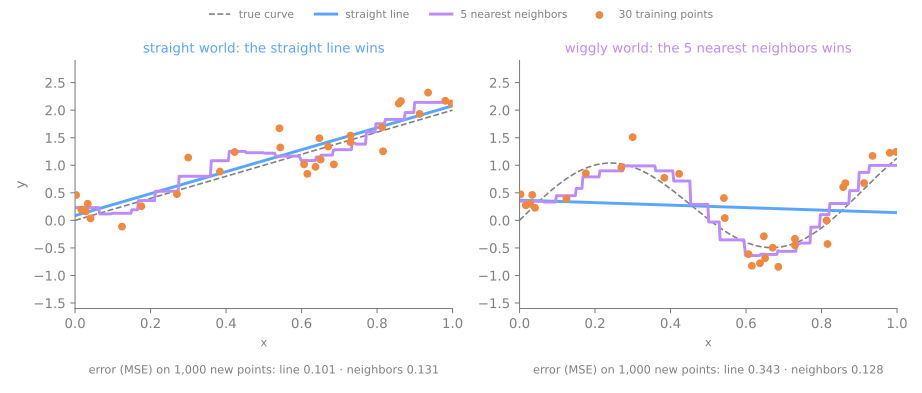
No free lunch
- Wolpert (1996): averaged over all possible problems, no learning algorithm is better than any other.
- In practice: there is no universally best model. Try several families and validate.
Two worlds, two winners
What the theorem does not say
not: "all models are equal"
on your dataset some are much better; finding which is the job of validation and model selection
not: "experience is useless"
real problems are not drawn at random; some families (boosted trees on tables) win often, because their assumptions match
Ethics: four questions before shipping a model
Models trained on historical data inherit historical bias.
fairness
equal performance across groups? A credit model trained on biased decisions reproduces them at scale
privacy
was the data collected with consent? can people be re-identified?
transparency
can decisions be explained to those affected?
feedback loops
does deploying the model change the data it will be retrained on? (predictive policing)
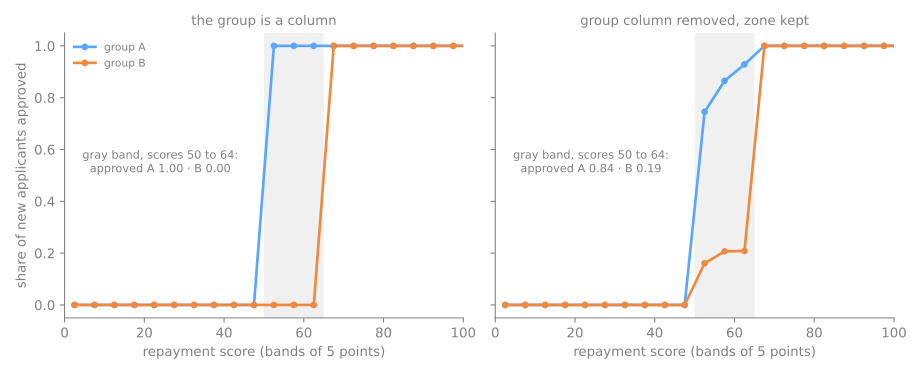
A model learns the past
4,000 past loans. Groups A and B repay alike, but officers approved A from a score of 50 and B only from 65. A small tree imitates them. Predict: at scores 50 to 64, what share of each group does it approve? And if the group column is deleted?
Who owns the decision
A feedback loop, day by day
One patrol, two neighborhoods: A has 10 incidents a day, B has 12. The model sends the patrol where more crime is recorded; elsewhere only 2 calls a day get recorded. Predict: will the patrol ever go to B?
Why retraining does not fix it
- Every record is a real incident; the records are wrong about where crime is, because the model decides where to look.
- Each new model is trained on records the previous one shaped: after 30 days, A 355 against B 105.
explore
one day in five, send the patrol where it went less
measure per effort
incidents per patrolled day, not raw totals
Summary: five questions for every project
- Is the problem framed? Target, moment, metric, baseline, before the data.
- What will the model meet? The expected loss on new data; a test set estimates it only if untouched.
- Why this model? No free lunch: compare several families and validate.
- What did the labels teach it? The past, biases included; proxies survive deleted columns.
- Does it choose its own data? Then explore, and measure per unit of effort.
No free lunch, a biased past and a loop that feeds itself, steps 5 to 7
- Step 5: two worlds, three models (the baseline among them), opposite winners.
- Step 6: a tree trained on biased loan decisions, measured group by group.
- Step 7: the patrol loop, run for 30 days.
- Same Colab notebook as the fundamental lab, same session; at every step, the Predict first.
- Simulations: delete the group column (step 6) and look where you do not look (step 7).
Pace: step 5 in 8 min; step 6 and the first simulation in 12 min; step 7 and the second in 10 min.