This lesson starts where the others ended
- Every lesson so far ended when the test score was printed.
- Value comes from predictions delivered reliably to the people who act on them.
- MLOps (machine-learning operations): the engineering habits that take a fitted pipeline into production and keep it honest there.
The model is the small box
Sculley et al. (2015), Hidden Technical Debt in Machine Learning Systems: the code that learns is a small box surrounded by infrastructure, and most failures happen in the infrastructure.
fit + define the modelThe rest load, check, package, serve, monitor and compare.
The loop, and what the monitor sends back
Click the buttons: what does a drift alert send back, and what does a data bug?
Every arrow can break without an error
| stage | fails silently when... |
|---|---|
| package | the file loads in another library version and predicts differently |
| serve | a malformed request still gets a confident-looking probability |
| train again | nobody can say which data, code and seed produced the model in production |
| monitor | the world changes and the model keeps answering as if it had not |
| serve vs train | the serving code computes a feature differently from the training code |
The first four rows are this part; the last one opens the advanced approach.
The path of this part
- Package the modelthe whole pipeline, pickle risks, pinned versions
- Serve predictionsbatch or online, a schema in front, an endpoint
- Reproduce and versionseeds, data fingerprints
- Monitor driftthree shifts, PSI and KS by hand, late labels
Packaging: the artifact is the whole pipeline
German credit (1,000 past loans): 3 numeric and 5 categorical columns → scaler + one-hot → logistic regression.
joblib.dump(pipe, path)                  # the WHOLE pipeline, one file
loaded = joblib.load(path)
np.array_equal(proba, loaded.predict_proba(X_test)[:, 1])
test ROC AUC
on disk
round trip
Why not ship the model alone?
LogisticRegression out of the pipeline and give it the raw table. What happens?
ValueError: X has 8 features, but LogisticRegression is expecting 30 features as input.
- The model saw the 30 columns of the column transformer: 3 standardized numbers + 27 one-hot indicators.
- Serving it alone means rebuilding those 30 columns by hand: same means, same category order, same unknowns. Any difference gives wrong predictions without an error.
A pickle is a program
class Innocent:
    def __reduce__(self):                 # tells pickle how to rebuild this object...
        return (print, ('this line ran while the file was being LOADED',))

obj = pickle.loads(pickle.dumps(Innocent()))   # ...and loading obeys
this line ran while the file was being LOADED
print with os.system and loading runs a shell command. Load model files only from sources you would trust to run code on your machine.Pin the versions
scikit-learn stamps its version in every saved estimator. Fake a file from another version by changing one digit of the stamp:
InconsistentVersionWarning for: ['StandardScaler', 'OneHotEncoder',
  'ColumnTransformer', 'LogisticRegression', 'Pipeline']
Every estimator complains, and the file still loads. It may predict differently.
- store the versions (Python, scikit-learn, NumPy) next to the model, in a metadata file;
- pin them in the serving environment (
requirements.txt, a container image); - when upgrading the library, retrain and re-validate.
Serving: how the model is called
| pattern | latency | example |
|---|---|---|
| batch | hours | nightly churn scores written to a database |
| online (an API, application programming interface) | milliseconds | credit decision during checkout |
| streaming | seconds | fraud flags on a transaction stream |
| edge | on the device | keyboard prediction on a phone |
The pipeline accepts garbage
| request | answer |
|---|---|
| good request | P(bad) = 0.626 |
| age = −3 | P(bad) = 0.784 |
| amount in thousands | P(bad) = 0.574 |
unseen purpose 'crypto' | P(bad) = 0.519 |
| housing missing | ValueError: columns are missing |
Only one. The other three get a probability that looks exactly as trustworthy as the good one.
A schema, and a function that checks it
Write down what the model saw in training (a range per number, a list per category) and check every request first:
| request | status | message |
|---|---|---|
| good request | ok | 0.626 |
| age = −3 | rejected | age: −3 outside training range [19, 75] |
| amount in thousands | rejected | credit_amount: 4 outside training range [250, 15945] |
| unseen purpose | rejected | purpose: unknown category 'crypto' |
| housing missing | rejected | housing: missing |
The same function behind an HTTP endpoint
HTTP: HyperText Transfer Protocol, the protocol of the web.
# app.py  (illustrative: run it with uvicorn, not in a notebook)
from fastapi import FastAPI
from service import predict_one           # the tested function

app = FastAPI()

@app.post('/predict')
def predict(payload: dict):
    return predict_one(payload)
predict_one, an ordinary function you can test in a notebook.Reproducibility: every ingredient has a version
| ingredient | what to record | typical tool |
|---|---|---|
| code | the commit that trained it | git |
| data | a fingerprint and a way to get the rows back | DVC (Data Version Control), lakeFS, snapshots |
| environment | library versions | lock files, a container |
| randomness | every seed | random_state |
| configuration | hyperparameters, features, thresholds | a config file in git |
| results | metrics, the artifact | tracker, model registry |
Seeds: same score, different decisions
Two random forests that differ only in their seed:
AUC
probabilities
decisions
Fingerprint the data
training data      68ad024c9661
one value changed  7eb64a1901f0
rows shuffled      a662547f0332
same data again    68ad024c9661
- One changed value out of 6,000 gives a completely different fingerprint; so does another row order.
- "Was it trained on this month's extract?" becomes a string comparison.
A hash only identifies the data; rebuilding needs the rows themselves (DVC, lakeFS, read-only snapshots).
Monitoring: models decay silently
The service keeps answering 200 OK while its predictions get worse. Three layers: system, data quality, statistical drift.
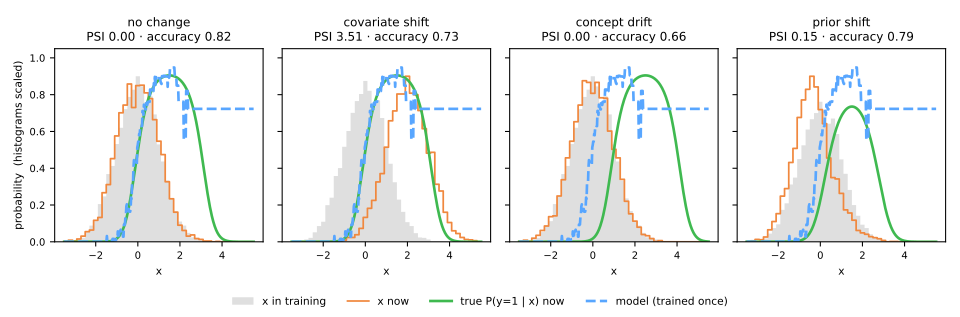
| shift | what changes | what stays fixed | example |
|---|---|---|---|
| covariate | \(P(x)\) | \(P(y \mid x)\) | the bank sells to younger clients |
| concept | \(P(y \mid x)\) | \(P(x)\) | a crisis changes who repays |
| prior | \(P(y)\) | \(P(x \mid y)\) | an epidemic: more patients are sick |
\(x\): the inputs of a request; \(y\): its label, the outcome the model predicts.
PSI, by hand: one bin at a time
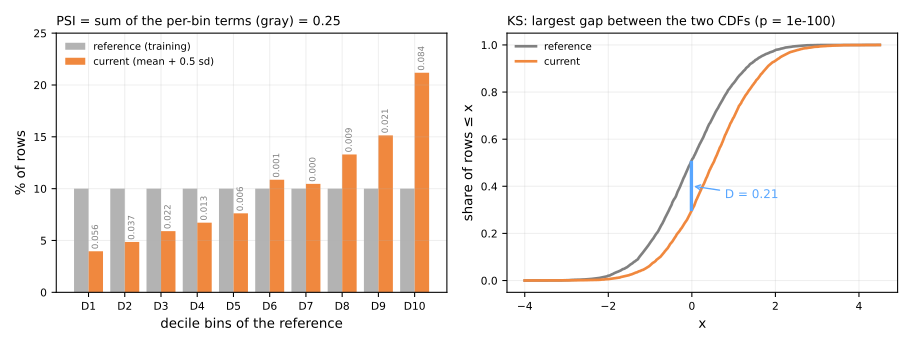
PSI (population stability index): bins cut at the training quartiles, \(e_i\) = expected share, \(a_i\) = this week's share. Predict. Which bin contributes most, and does the sum pass 0.25?
What does PSI = 0.25 mean?
| mean moved by | 0 | 0.1 sd | 0.25 sd | 0.5 sd | 1 sd |
|---|---|---|---|---|---|
| PSI (10 bins) | 0.005 | 0.015 | 0.064 | 0.250 | 0.929 |
The alarm level is a move of half a standard deviation (sd). With no shift at all, PSI is not exactly zero: two samples never have identical histograms.
Usual reading (Siddiqi, 2006): below 0.1 no meaningful change · 0.1 to 0.25 worth watching · above 0.25 significant.
Simulator: move the production distribution
Predict. Turn on concept drift without moving the inputs. What happens to PSI, and to the accuracy?
The KS statistic, by hand
KS (Kolmogorov–Smirnov): \(D = \max_x |F_{\text{ref}}(x) - F_{\text{cur}}(x)|\), \(F\) = share of the sample at or below \(x\). Reference 1–5, current 3–7. Predict. At which \(x\) is the gap largest?
Both statistics on 5,000 rows
The three shifts, measured
| PSI(x) | KS p | accuracy | precision | actual rate | mean predicted | |
|---|---|---|---|---|---|---|
| no change | 0.004 | 0.695 | 0.816 | 0.769 | 0.462 | 0.465 |
| covariate shift | 3.505 | 0.000 | 0.728 | 0.729 | 0.720 | 0.780 |
| concept drift | 0.003 | 0.340 | 0.660 | 0.329 | 0.167 | 0.459 |
| prior shift | 0.152 | 0.000 | 0.794 | 0.491 | 0.200 | 0.339 |
Labels arrive late: monitoring at two speeds
immediately
data-quality checks, PSI or KS of each input, and the distribution of the model's own scores: one of the most effective shift detectors, for one line (Rabanser et al., 2019)
later, with the outcomes
the real metrics (AUC, precision, calibration) per batch, against the validation estimate
Summary
- Ship the whole pipeline, check the round trip, pin the versions; a pickle is a program.
- Put a schema in front of the model: reject the impossible, warn on the new, answer with the version.
- Version code, data (a fingerprint), environment, seeds and configuration.
- Measure shifts with magnitudes: PSI bin by bin, the KS statistic as the largest gap.
- Monitor inputs and scores at once, outcomes later; only labels reveal concept drift.
| symptom | what to do |
|---|---|
| a broken request gets a normal-looking probability | a schema: reject or warn |
| an input's PSI is above 0.25 | look upstream before retraining |
| inputs stable, accuracy falling once labels arrive | concept drift: outcome metrics, audited labels |
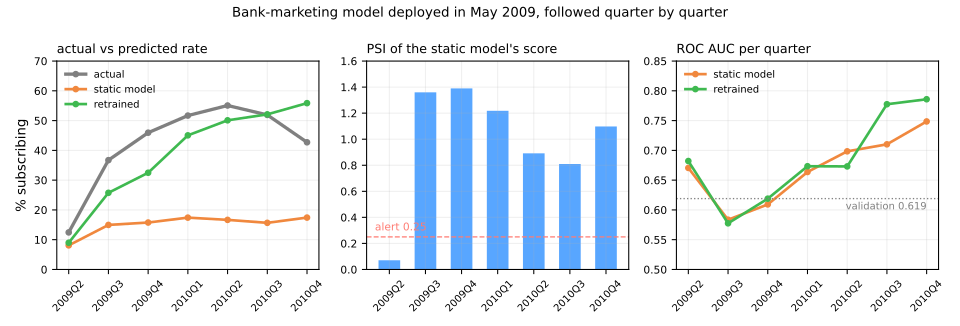
Shipping and monitoring a bank-marketing model, steps 1 to 8
45,211 telemarketing calls, May 2008 to November 2010, in the order they were made. Deployed on 1 May 2009, followed for 19 months.
Build and validate (1–3), package and guard (4–6), monitor without labels (7), then with them (8). At every step, answer the Predict before running.
Simulations: the leak, in production (step 2) and where the PSI of contact comes from (step 7).
Lab notebook (Jupyter or Colab, File → Upload notebook).
Pace: steps 1 and 2 and the first simulation in 12 min; steps 3 to 6 in 15 min; step 7 and the second in 13 min; step 8 in 5 min.