The path of this part
- Scale for gradientsthe curvature of the loss; one learning rate
- Choose the powerBox-Cox, Yeo-Johnson, quantiles
- Encode for the modelthe dropped column; hundreds of levels; target encoding
- Impute from the other columnsKNNImputer, IterativeImputer; check the values
- Assemble the recipethe map, column by column
A long valley or a round bowl
With a squared loss, the curvature along each direction is set by the variance of the features: the eigenvalues of \(M^\top M / n\), with \(M\) the centered (age, fare) matrix of \(n\) rows.
| raw | 208.62, 2798.59 | ratio 13.4 |
| standardized | 0.9, 1.1 | ratio 1.2 |
A learning rate safe for the steep direction crawls along the flat one.
Let the data choose the power
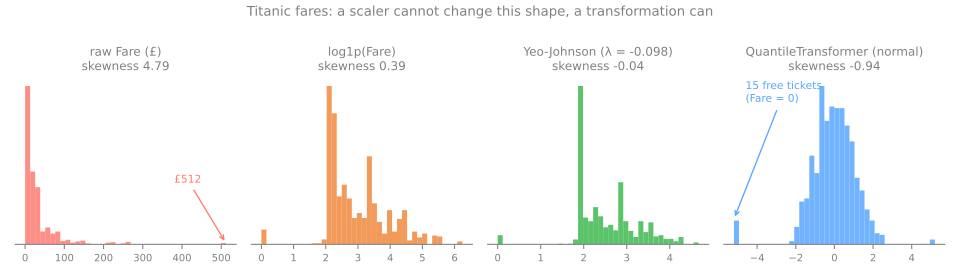
Box-Cox
\(x' = (x^\lambda - 1)/\lambda\), \(\lambda = 0\) means \(\log x\); \(\lambda\) by maximum likelihood. Needs \(x > 0\): refuses the 15 free tickets.
Yeo-Johnson
accepts zero and negatives. \(\lambda = -0.098\), close to a log → skewness −0.04.
QuantileTransformer
replaces each value by its rank → −0.94; the 15 free tickets pile up at −5.20.
PowerTransformer standardizes its output by default (shape, then scale). Quantiles keep only the order.One-hot and the intercept: the dropped column
| port | intercept | C | Q | S | C + Q + S |
|---|---|---|---|---|---|
| S | 1 | 0 | 0 | 1 | 1 |
| C | 1 | 1 | 0 | 0 | 1 |
| S | 1 | 0 | 0 | 1 | 1 |
| Q | 1 | 0 | 1 | 0 | 1 |
| S | 1 | 0 | 0 | 1 | 1 |
| C | 1 | 1 | 0 | 0 | 1 |
The three port columns always add up to the intercept's column: rank 3 for 4 columns.
The weights are not unique: add 5 to the three port weights, subtract 5 from the intercept, same predictions.
drop='first' removes C, the reference: rank 3 for 3 columns, each coefficient reads "compared with Cherbourg".
drop='first' for linear models with an intercept and no penalty. Keep every column for trees, k-NN (k nearest neighbors) and regularized models: for a distance, "reference" and "unknown" would both be 0 0.High cardinality, and target encoding
Ticket has 681 distinct values for 891 rows: one-hot would create 681 columns of almost only zeros, a recipe for overfitting.
- First look for the structure inside: the deck letter of
Cabin, the title inName(Mr, Miss, Mrs, Master...). - Then group rare levels:
min_frequency=10keeps 4 titles and merges the other 13. - Target encoding: replace each category by the mean of the target in it. One column, whatever the cardinality.
Target encoding leaks
| encoding of pure noise | train | test |
|---|---|---|
| naive per-category mean | 0.775 | 0.505 |
TargetEncoder (cross-fitted) | 0.496 | 0.505 |
- Most tickets appear once or twice, so a row's encoded value is mostly its own label: the model learns to read the answer, not to predict it.
- Cross-fitting:
fit_transformencodes each fold with means from the other folds, so no row sees its own label; rare categories are shrunk toward the global mean.
fit_transform on train, transform on test. Target-free options: frequency encoding, hashing.KNNImputer, by hand
Mr. James Moran paid £8.46 and has no age. The imputer looks for the \(k = 2\) passengers with the closest fare and averages their ages.
| passenger | age | fare | |fare − 8.46| | |
|---|---|---|---|---|
| 3 | 26 | £7.93 | 0.5 | |
| 1 | 22 | £7.25 | 1.2 | |
| 4 | 35 | £53.10 | 44.6 | |
| 2 | 38 | £71.28 | 62.8 |
Imputing from the other columns
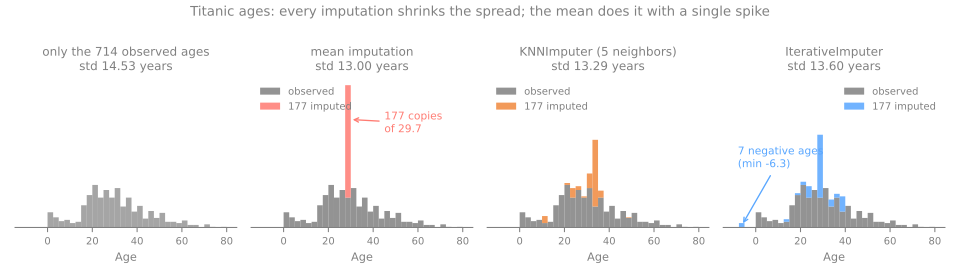
KNNImputer
average of the \(k\) most similar rows. On class, siblings and parents: std 13.29, no impossible age.
IterativeImputer
a regression of each column on the others, cycled (MICE, multivariate imputation by chained equations). It produced 7 negative ages: it does not know that age is positive.
The preprocessing map
Per column: missing values → shape → scale, every step fitted on the training rows. Click the answers to build a recipe.
Which families care about which step
| model family | scaling | shape | encoding | missing values |
|---|---|---|---|---|
| k-NN, k-means, SVM, PCA | required | helps | one-hot | must be imputed |
| linear/logistic regression, neural networks | required | helps | one-hot, drop='first' if no penalty | must be imputed |
| trees, random forests, gradient boosting | not needed | not needed | ordinal codes are fine | scikit-learn's trees accept NaN |
SVM: support vector machine; PCA: principal component analysis; NaN: not a number, a missing value.
Summary
- Scaling also makes the loss round: one learning rate for every weight.
- Let the data choose the power: Yeo-Johnson accepts zeros; \(\lambda\) is learned on train.
drop='first'only for linear models with an intercept and no penalty.- Hundreds of levels: structure, rare levels grouped, cross-fitted target encoding.
- Imputers that use the other columns spread the guesses; check what they invent.
One object, a black-box model and smarter imputers: steps 7 to 9
- Step 7: every statistic in one
ColumnTransformer: 12 columns, noNaN, no text. - Step 8: a k-NN used as a black box, with and without scaling. Step 9: imputers that use the other columns.
- Continue in the lab notebook, in the same session.
- Simulations: shape before scale (step 8) and a smarter imputer inside the pipeline (step 9).
Pace: step 7 in 5 min; step 8 and the first simulation in 10 min; step 9 and the second in 10 min.