The algorithm only sees numbers
It minimizes the cost with the numbers you hand it. If they are badly prepared, it minimizes the wrong thing, with full confidence.
incompatible scales
the column with the biggest numbers dominates distances and penalties
Fare 0 to 512, SibSp 0 to 8
text
there is no arithmetic with "female"
Sex, Embarked, Cabin, Ticket, Name
holes
most implementations refuse NaN (not a number, a missing value)
Age missing for 19.9%, Cabin for 77.1%
Each step is measured on a few numbers you can check with a calculator, then on the Titanic (891 passengers of the 1912 voyage). EDA (exploratory data analysis) looked at the table; this lesson changes it.
The path of this part
- Scaleunits decide distances; four scalers
- Fit on train onlyfit once on the training rows, transform the rest
- Fix the shapeskewness; a log, not a scaler
- Encode categoriesordinal, one-hot, unseen categories
- Impute the holeswhy it is missing; one value; a flag
Three passengers, by hand
| passenger | age | fare | |
|---|---|---|---|
| A | Braund, Mr. Owen Harris (3rd class) | 22.0 | £7.25 |
| B | Connors, Mr. Patrick | 70.5 | £7.75 |
| C | Pears, Mrs. Thomas (1st class) | 22.0 | £66.60 |
In raw units, the 70-year-old wins
| pair | age difference | fare difference | distance |
|---|---|---|---|
| A–B | 48.5 years | £0.50 | \(\sqrt{48.5^2 + 0.5^2} = 48.50\) |
| A–C | 0 years | £59.35 | \(\sqrt{0^2 + 59.35^2} = 59.35\) |
48.5 years is a smaller number than 59.35 pounds. Nothing says a year and a pound should weigh the same: it is just what happens when you subtract raw numbers.
Standardized, the ranking flips
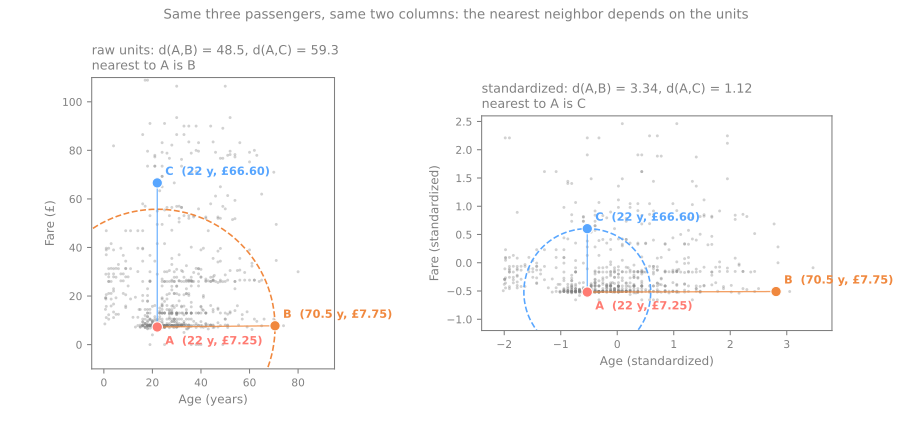
A–B: \(48.5 / 14.52 = \mathbf{3.34}\) std
A–C: \(59.35 / 52.88 = \mathbf{1.12}\) std
\(\mu\) and \(\sigma\) computed over the 714 passengers whose age is known.
Simulator: the unit decides the neighbors
Predict. Slide the income unit from thousands to cents. Do the 5 nearest neighbors of the red point stay the same? Then press standardize.
Which column owns the distance?
For two random rows, the expected squared difference in a column is twice its variance: each column's share of the distance is its share of the total variance. Titanic, four numeric columns:
| column | raw | standardized | |
|---|---|---|---|
Fare | 92.9% | 25% | |
Age | 7.0% | 25% | |
SibSp | 0.0% | 25% | |
Parch | 0.0% | 25% |
Which models care about scale
care
- distance-based: k-NN, k-means, kernel SVMs (support vector machines)
- variance-based: PCA, principal component analysis (the largest-scale feature wins by default)
- gradient-based and penalized: linear and logistic regression, neural networks, Ridge/Lasso
do not care
Trees, random forests, gradient boosting: they split on one feature at a time ("is Age < 12?").
Any increasing transformation moves the threshold but sends the same rows to each side.
Four scalers: \(x' = (x - \text{center}) / \text{spread}\)
| scaler | formula | center | spread | result |
|---|---|---|---|---|
StandardScaler | \((x - \mu) / \sigma\) | mean | standard deviation | mean 0, std 1 |
MinMaxScaler | \((x - x_{\min}) / (x_{\max} - x_{\min})\) | minimum | range | values in \([0, 1]\) |
RobustScaler | \((x - \text{median}) / \text{IQR}\) | median | IQR \(= Q_3 - Q_1\) | median 0, IQR 1 |
MaxAbsScaler | \(x / \max \lvert x \rvert\) | none (0 stays 0) | largest \(\lvert x \rvert\) | values in \([-1, 1]\) |
Four scalers, step by step
Five household incomes, R$ thousand: 1, 2, 3, 4 and 40. Predict. Which scaler will keep the four ordinary households most spread out, and which will squeeze them together?
Same geometry, different weight next to other columns

Inside the column the ordinary households always occupy the same 8% of the range: a linear map cannot change proportions. What changes is how big their differences are compared with the other columns, and that is what a distance adds up.
MinMaxScaler, next to an age column with std 1, two ordinary households look almost identical in income, and age decides everything.Choosing a scaler
| scaler | effect of outliers | typical use |
|---|---|---|
StandardScaler | moderate: they inflate \(\sigma\) | the default: linear models, SVM, PCA, neural networks |
MinMaxScaler | strong: one extreme value compresses the rest | a bounded range is required (pixel intensities) |
RobustScaler | weak: they are simply left far away | columns with outliers you decided to keep |
MaxAbsScaler | strong, like min-max | sparse data: zeros stay zeros |
- Normalization is ambiguous (min-max? "make it normal"? scikit-learn's
Normalizerrescales each row). Write the formula. - A new value outside the training range leaves the interval: an income of 80 becomes \((80-1)/39 = 2.03\) under min-max.
Fit on the training set, transform everything else
A mean or a standard deviation is a parameter of your model, just like a weight.
fit
learns the statistics and stores them (mean_, scale_)
transform
applies the stored statistics, frozen
fit_transform
both, on the same data
fit once, on the training rows. Validation, test and production only ever see transform. The same rule holds for every step of this lesson: scalers, encoders, imputers.Four ways to call the scaler, step by step
Training ages 20, 25, 30, 35, 40; new passengers aged 60 and 70. Predict. If someone calls StandardScaler().fit_transform(test) on the two new rows, what values do 60 and 70 receive?
Skewed features: a scaler cannot change the shape
Titanic fares: half cost less than £14.46, three cost £512, and 15 tickets were free. Skewness \(= \frac{1}{n}\sum z_i^3\), the mean of the cubed z-scores of the \(n\) values: 0 when symmetric, positive with a long right tail.
StandardScaler?| fare | skewness |
|---|---|
| raw | 4.79 |
| standardized | 4.79 |
| square root | 2.09 |
\(\log(1 + x)\), np.log1p | 0.39 |
A nonlinear map is needed. Log turns multiplications into additions (£8 → £80 and £50 → £500 become equal steps); log1p because \(\log 0 = -\infty\). Order: shape, then scale; check the skewness afterwards.
Encoding: three kinds of categories
nominal
no order: port, color, city
→ one-hot
ordinal
a real order: ticket class, education, size S < M < L
→ integers in that order
binary
two categories: Sex
→ one 0/1 column
The tempting shortcut: OrdinalEncoder numbers the ports alphabetically, Cherbourg = 0, Queenstown = 1, Southampton = 2.
Codes or one-hot, row by row
The three ports, encoded twice. Predict. With integer codes, which two ports does a distance put farthest apart? And with one-hot?
One slope cannot fit two steps
survival by port
| C (code 0) | 0.554 |
| Q (code 1) | 0.390 |
| S (code 2) | 0.337 |
Steps of 16.4 and 5.3 points. A linear model gives the code column one coefficient, so both steps are forced to be equal.
what to do
One-hot gives each port its own coefficient, and no alphabet decides the order.
Trees are the exception: cuts at 0.5 and 1.5 isolate each code, so integer codes are fine for them.
Ordinal: you declare the order
OrdinalEncoder().fit(levels).categories_
# ['bachelor', 'high school', 'master']   alphabetical!
OrdinalEncoder(categories=[['high school', 'bachelor', 'master']])
# codes now follow the real order: 0, 1, 2
The alphabet puts high school between bachelor and master.
Pclass is already 1, 2, 3. Ordinal (one column) or nominal (three one-hot columns) is a modeling choice: ordinal assumes 1st → 2nd matters as much as 2nd → 3rd.One-hot: a category never seen in training
Trained on the ports S, C, S, Q, S, C. Two new passengers arrive: one from Q, one from Belfast (B).
| new port | Embarked_C | Embarked_Q | Embarked_S | default |
|---|---|---|---|---|
| Q | 0 | 1 | 0 | fine |
| B | 0 | 0 | 0 | ValueError: the prediction crashes |
handle_unknown='ignore', B becomes 0 0 0, "none of the categories I know". Common in practice: a rare category may simply not land in the training split.Missing values: why is it missing?
| mechanism | what it means | Titanic example |
|---|---|---|
| MCAR, missing completely at random | depends on nothing | the 2 missing Embarked, plausibly |
| MAR, missing at random | depends on other observed columns | Age, missing more in 3rd class |
| MNAR, missing not at random | depends on the missing value itself | Cabin: no cabin of their own |
Age missing, by class
1st 13.9% · 2nd 6.0% · 3rd 27.7%
survival
age known 40.6% · age missing 29.4%
dropna() would cost 177 rows (19.9%), mostly 3rd class: the passengers who died most would be under-represented.Mean imputation, step by step
Six values, two missing: 2, 4, ?, 6, ?, 8. Predict. After both holes are filled with the mean, will the variance go up, stay at 5 or go down?
Keep the fact that it was missing
imp = SimpleImputer(strategy='median', add_indicator=True)
imp.get_feature_names_out()   # ['Age' 'missingindicator_Age']
# passenger 1: [22, 0]    passenger 6: [28, 1]
Missing age goes with lower survival (29.4% against 40.6%). The flag costs one column and lets the model decide whether missingness is informative. For categories: a category of its own, 'unknown'.
Summary
- Raw units decide distances by accident: scale what distances, variances and penalties use.
- Scalers differ in center and spread; an outlier sets the scale of all but
RobustScaler. - Fit on train, transform everything else.
- A scaler cannot fix the shape:
log1p, then scale. - One-hot for nominal, declared order for ordinal;
handle_unknown='ignore'. - Ask why it is missing; filling shrinks the spread; keep a flag.
| symptom | what to do |
|---|---|
| one column decides every neighbor | standardize the numeric columns |
| scaled test columns with mean exactly 0 | the scaler saw the test: fit on train only |
Preparing the Titanic, column by column: steps 1 to 6
- Inventory, split first (712 train, 179 test), why
Ageis missing, impute it, one-hotSex,Embarked,Pclass, scale the numbers. - Lab notebook: open it in Jupyter or Colab (File → Upload notebook).
- At every step, answer the Predict before running.
- Simulations: the shrinkage law, on holes you make (step 4) and whose neighbors? (step 6).
Pace: steps 1 to 3 in 8 min; step 4 and the first simulation in 10 min; steps 5 and 6 and the second in 12 min.