Explicabilidade
Os modelos que venceram as últimas aulas, random forests, gradient boosting e redes neurais, têm um defeito em comum: ninguém consegue lê-los. Um ensemble de 200 árvores com boosting faz uma boa previsão, mas a pergunta "por que este número?" não tem resposta que caiba numa página. Esta aula trata de obter essa resposta mesmo assim: em quais atributos um modelo se apoia (explicações globais) e por que ele fez esta previsão para esta linha (explicações locais).
Cada método abaixo é calculado primeiro à mão, em poucas linhas de NumPy; só depois é chamado de uma biblioteca, que precisa devolver os mesmos números. O exemplo que acompanha a aula é o conjunto California housing do lab de seleção de modelos: prever o valor mediano das casas de um distrito a partir da renda, das casas e da localização. O lab no fim aplica tudo a uma pergunta em que explicar é uma questão legal: por que este solicitante de crédito foi marcado como de alto risco?
Todo número citado vem dos blocos de código ou dos scripts de figura que acompanham esta página.
A aula segue um caminho em quatro etapas, desenhado abaixo: 1. legível primeiro, conferir se um modelo interpretável basta; 2. global, de quais atributos o modelo depende e com que forma (importância por permutação, dependência parcial e curvas ICE, de expectativa condicional individual); 3. local, por que o modelo fez uma previsão (valores SHAP, do inglês SHapley Additive exPlanations; LIME, do inglês Local Interpretable Model-agnostic Explanations); 4. ler com cuidado, o que uma explicação pode e não pode afirmar. Cada etapa leva à sua seção; nos slides, uma faixa embaixo mostra em que etapa você está.
- Legível primeirocoeficientes, regras de árvore, o preço da legibilidade
- Global: o que importaimportância por permutação, dependência parcial, ICE
- Local: uma previsãovalores SHAP, LIME
- Ler com cuidadocausalidade, certo pelos motivos errados, um checklist
Slides
Clique nos slides e use as setas ← → para navegar; F abre em tela cheia e Esc mostra todos os slides. Abrir os slides numa aba nova
Por que explicar um modelo?
Quatro motivos aparecem sempre:
- Depuração. Desconfie de um modelo que parece bom demais. Na seção de vazamento da aula de validação cruzada, a cura começava com uma pergunta: qual atributo está fazendo o trabalho? Uma coluna vazada aparece no topo de qualquer ranking de importância (você vai plantar uma no lab e ver isso acontecer).
- Confiança. Um médico, um analista de crédito ou um juiz não vai agir com base num número que não pode questionar. Uma explicação que bate com o que eles sabem gera confiança; uma que não bate é uma descoberta ou um bug; vale a pena saber qual dos dois.
- Regulação. A Lei Geral de Proteção de Dados (LGPD, Lei 13.709/2018, art. 20) dá às pessoas o direito de pedir a revisão de decisões tomadas unicamente com base em tratamento automatizado (inclusive as de crédito) e de receber "informações claras e adequadas" sobre os critérios usados. O GDPR europeu (art. 22) e as regras americanas para recusa de crédito, que obrigam o credor a informar os principais motivos, vão na mesma direção (veja também a discussão de ética da aula de panorama do ML).
- Ciência. Às vezes o modelo é uma ferramenta para aprender sobre o mundo: quais medidas preveem uma doença, quais condições preveem uma quebra de safra. Aí a explicação é o resultado.
Duas distinções organizam os métodos:
- global vs local: como o modelo se comporta no geral? contra por que esta previsão?;
- específico vs agnóstico ao modelo: alguns métodos leem o interior do modelo (coeficientes, divisões das árvores); outros só chamam
predicte servem para qualquer modelo.
| Método | Pergunta que responde | Escopo | Precisa de |
|---|---|---|---|
| Coeficientes, regras de árvore | o próprio modelo | global | um modelo interpretável |
| Importância por impureza (MDI) | quais atributos as divisões do treino mais usaram? | global | árvores |
| Importância por permutação | quanto o escore depende de cada atributo? | global | qualquer modelo + dados rotulados |
| Dependência parcial (PDP) | como a previsão média muda com um atributo? | global | qualquer modelo |
| Curvas ICE | ... e para cada linha? | local, muitas linhas | qualquer modelo |
| Valores SHAP | quanto cada atributo afastou esta previsão da média? | local; global por agregação | qualquer modelo; exato e rápido para árvores |
| LIME | qual modelo linear imita a caixa-preta em volta desta linha? | local | qualquer modelo |
Interpretável por construção
Etapa 1. Antes de explicar uma caixa-preta, pergunte se você precisa de uma. Primeiro, os dados. O arquivo cru traz totais por distrito; nós os transformamos em quantidades por domicílio, mais fáceis de ler:
import numpy as np
import pandas as pd
from sklearn.model_selection import KFold, cross_val_score, train_test_split

url = 'https://raw.githubusercontent.com/hsandmann/biblio/refs/heads/main/ml/aula02/housing.csv'
df = pd.read_csv(url).dropna()               # descarta os 207 distritos sem contagem de quartos
X = pd.DataFrame({
    'income':     df['median_income'],                   # renda mediana dos domicílios, em US$ 10.000
    'house_age':  df['housing_median_age'],              # idade mediana das casas, em anos
    'rooms':      df['total_rooms'] / df['households'],  # cômodos por domicílio
    'bedrooms':   df['total_bedrooms'] / df['households'],
    'population': df['population'],                      # pessoas que moram no distrito
    'occupancy':  df['population'] / df['households'],   # pessoas por domicílio
    'latitude':   df['latitude'],
    'longitude':  df['longitude'],
})
y = df['median_house_value'] / 1000          # valor mediano das casas, em US$ 1.000
X_train, X_test, y_train, y_test = train_test_split(X, y, test_size=0.2, random_state=42)
print(X_train.shape, X_test.shape)
Três candidatos, do totalmente legível ao nada legível, nos mesmos cinco folds:
from sklearn.ensemble import GradientBoostingRegressor
from sklearn.linear_model import LinearRegression
from sklearn.tree import DecisionTreeRegressor

cv = KFold(n_splits=5, shuffle=True, random_state=42)
models = {'linear regression': LinearRegression(),
          'tree, depth 3':     DecisionTreeRegressor(max_depth=3, random_state=0),
          'gradient boosting': GradientBoostingRegressor(n_estimators=200, max_depth=4, random_state=0)}
for name, m in models.items():
    r2 = cross_val_score(m, X_train, y_train, cv=cv, scoring='r2')
    print(f"{name:18s} R² {r2.mean():.3f} ± {r2.std():.3f}")
linear regression  R² 0.602 ± 0.017
tree, depth 3      R² 0.526 ± 0.016
gradient boosting  R² 0.823 ± 0.007
Os dois modelos legíveis são mesmo legíveis. A regressão linear são oito números:
linear = LinearRegression().fit(X_train, y_train)
print(pd.Series(linear.coef_, index=X.columns).round(2))
print(f"correlation rooms/bedrooms: {X['rooms'].corr(X['bedrooms']):.2f} · "
      f"latitude/longitude: {X['latitude'].corr(X['longitude']):.2f}")
income        44.14
house_age      0.91
rooms        -11.65
bedrooms      63.55
population    -0.00
occupancy     -0.34
latitude     -41.30
longitude    -42.64
dtype: float64
correlation rooms/bedrooms: 0.85 · latitude/longitude: -0.92
Cada coeficiente é uma frase: com os outros atributos fixos, US$ 10.000 a mais de renda mediana somam US$ 44.140 ao valor previsto e um grau mais ao norte tira US$ 41.300. A regressão logística dava o mesmo tipo de frase em razões de chances; é por isso que os scorecards de crédito são regressões logísticas há décadas. As letras miúdas daquelas aulas continuam valendo: "com os outros fixos" é uma hipótese forte quando os atributos andam juntos. Aqui rooms e bedrooms (correlação 0,85) recebem sinais opostos, −11,65 e +63,55: um quarto a mais com o número de cômodos fixo significa converter um cômodo em quarto, uma frase difícil de ler como afirmação sobre casas.
A árvore de profundidade 3 são oito regras:
from sklearn.tree import export_text

tree = DecisionTreeRegressor(max_depth=3, random_state=0).fit(X_train, y_train)
print(export_text(tree, feature_names=list(X.columns), decimals=1))
|--- income <= 5.0
|   |--- income <= 3.1
|   |   |--- rooms <= 4.3
|   |   |   |--- value: [162.6]
|   |   |--- rooms >  4.3
|   |   |   |--- value: [117.8]
|   |--- income >  3.1
|   |   |--- occupancy <= 2.4
|   |   |   |--- value: [282.2]
|   |   |--- occupancy >  2.4
|   |   |   |--- value: [188.9]
|--- income >  5.0
|   |--- income <= 6.6
|   |   |--- occupancy <= 2.6
|   |   |   |--- value: [354.6]
|   |   |--- occupancy >  2.6
|   |   |   |--- value: [260.5]
|   |--- income >  6.6
|   |   |--- income <= 7.8
|   |   |   |--- value: [367.6]
|   |   |--- income >  7.8
|   |   |   |--- value: [457.9]
Qualquer pessoa segue um distrito árvore abaixo: renda acima de US$ 78.000 → US$ 457.900. Mas, nestes dados, a legibilidade tem um preço, que a validação cruzada mediu: o ensemble com boosting explica 0,823 da variância, o modelo linear 0,602 e a árvore 0,526. Abrir mão de vinte e dois pontos de R² é demais, então aqui a caixa-preta vence:
model = GradientBoostingRegressor(n_estimators=200, max_depth=4, random_state=0).fit(X_train, y_train)
print(f"test R²: {model.score(X_test, y_test):.3f}")
Daqui em diante, model é essa caixa-preta (200 árvores com até 16 folhas cada); o resto da aula a abre. A diferença nem sempre existe. No lab, com dados de crédito, uma regressão logística e uma random forest empatam estatisticamente. Rudin (2019) argumenta que em decisões de alto risco esse é o caso comum: quando um modelo interpretável é tão bom quanto, use-o, em vez de explicar uma caixa-preta a posteriori.
Importância por permutação
À mão
Etapa 2. A pergunta agnóstica mais antiga é global: quanto o modelo precisa de cada atributo? Breiman (2001) a respondeu para random forests com um truque que funciona para qualquer modelo. Tome dados separados, embaralhe uma coluna e meça quanto o escore cai. O embaralhamento mantém os valores da coluna (e, portanto, a distribuição dela), mas quebra o vínculo dela com o alvo e com as outras colunas de cada linha. Se o modelo dependia dessa coluna, agora recebe lixo e o escore cai; se a ignorava, nada acontece.
O método inteiro é um laço:
from sklearn.metrics import r2_score

rng = np.random.default_rng(0)
base = r2_score(y_test, model.predict(X_test))
drops = {}
for col in X_test.columns:
    d = []
    for _ in range(5):                                   # 5 embaralhamentos diferentes por coluna
        X_perm = X_test.copy()
        X_perm[col] = rng.permutation(X_perm[col].to_numpy())
        d.append(base - r2_score(y_test, model.predict(X_perm)))
    drops[col] = np.mean(d)
print(f"R² with nothing shuffled: {base:.3f}")
print(pd.Series(drops).sort_values(ascending=False).round(3))
R² with nothing shuffled: 0.825
latitude      1.330
longitude     1.168
income        0.539
occupancy     0.139
rooms         0.054
house_age     0.035
bedrooms      0.008
population    0.002
dtype: float64
O permutation_importance do scikit-learn é o mesmo laço, com seus próprios embaralhamentos, então os números concordam até cerca de duas casas. Ao lado, a importância por impureza do modelo (MDI, feature_importances_), que o gradient boosting também calcula:
from sklearn.inspection import permutation_importance

pi = permutation_importance(model, X_test, y_test, scoring='r2', n_repeats=5, random_state=0)
print(pd.DataFrame({'permutation': pi.importances_mean, 'MDI': model.feature_importances_},
                   index=X.columns).sort_values('permutation', ascending=False).round(3))
            permutation    MDI
latitude          1.346  0.103
longitude         1.187  0.117
income            0.532  0.567
occupancy         0.134  0.130
rooms             0.056  0.024
house_age         0.035  0.042
bedrooms          0.009  0.009
population        0.003  0.009
Embaralhar a renda custa 0,539 de R², embaralhar a população 0,002: o modelo mal olha para a população. A MDI conta outra história, com mais da metade do total para a renda (0,567) e cerca de um décimo cada para latitude e longitude; as duas colunas não medem a mesma coisa, como mostra a próxima seção. E as duas primeiras linhas da coluna de permutação parecem impossíveis. Embaralhar a latitude "custa" 1,330, levando o R² de 0,825 para cerca de −0,5, bem pior do que prever a média para todo mundo. Guarde esse número, explicado duas seções abaixo: ele diz mais sobre o método do que sobre o modelo.
Dados separados, não dados de treino
A aula de árvores de decisão e a aula de random forest mediram o ponto fraco clássico da importância por impureza (MDI, feature_importances_): ela é calculada nos dados de treino durante o ajuste e premia colunas com muitos valores distintos, até ruído puro. A importância por permutação só corrige isso se você embaralhar em dados separados. Para ver os dois efeitos, dê a uma random forest duas colunas de ruído (uma contínua e um cara ou coroa) e calcule as importâncias de três jeitos:
from sklearn.ensemble import RandomForestRegressor

rng = np.random.default_rng(0)
X_train_n = X_train.assign(noise=rng.normal(size=len(X_train)), coin=rng.integers(0, 2, len(X_train)))
X_test_n = X_test.assign(noise=rng.normal(size=len(X_test)), coin=rng.integers(0, 2, len(X_test)))
forest = RandomForestRegressor(n_estimators=100, random_state=0, n_jobs=-1).fit(X_train_n, y_train)
on_train = permutation_importance(forest, X_train_n, y_train, n_repeats=5, random_state=0)
on_test = permutation_importance(forest, X_test_n, y_test, n_repeats=5, random_state=0)
print(pd.DataFrame({'MDI': forest.feature_importances_,
                    'perm. on train': on_train.importances_mean,
                    'perm. on test': on_test.importances_mean}, index=X_train_n.columns).round(3))
              MDI  perm. on train  perm. on test
income      0.516           0.875          0.754
house_age   0.052           0.117          0.068
rooms       0.042           0.068          0.025
bedrooms    0.026           0.032          0.008
population  0.030           0.033          0.005
occupancy   0.137           0.298          0.186
latitude    0.088           0.488          0.415
longitude   0.088           0.385          0.319
noise       0.018           0.016         -0.000
coin        0.002           0.002         -0.000
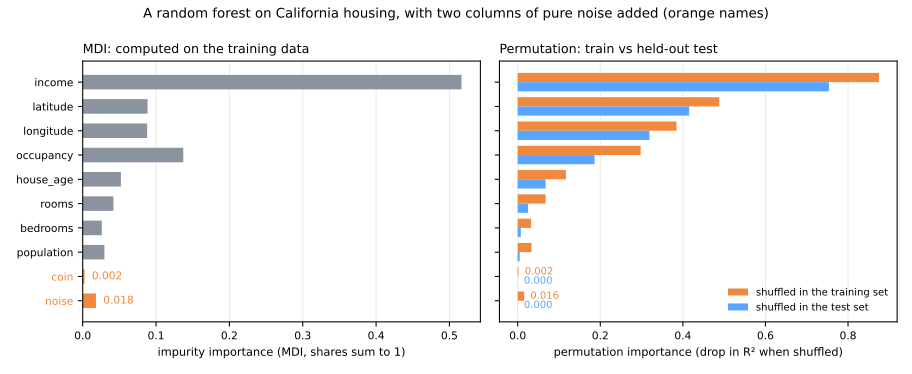
- A MDI dá ao ruído contínuo 0,018 do total (contra 0,002 do cara ou coroa de dois valores), mais da metade do que recebem
bedroomsoupopulation. As divisões profundas da floresta usaram mesmo esse ruído, nas linhas de treino. - A permutação no treino se engana do mesmo jeito: embaralhar
noisecusta 0,016 de R², porque a floresta memorizou linhas de treino em parte por meio dele. Todo atributo real também parece mais importante nos dados de treino (renda 0,875 contra 0,754): o modelo ajusta as linhas de treino melhor do que as novas, então tem mais a perder ali. - A permutação no teste dá ao ruído exatamente nada (−0,000; valores levemente negativos são ruído do embaralhamento em torno de zero). Este é o número a reportar.
Atributos correlacionados: crédito dividido e linhas impossíveis
A importância por permutação embaralha uma coluna enquanto as outras ficam paradas. Quando os atributos são correlacionados, isso tem duas consequências, uma em cada direção.
Crédito dividido. A aula de random forest mostrou que uma cópia exata divide a importância de um atributo. A cura que ela sugeria, embaralhar o par junto, custa uma linha a mais:
X_train_d = X_train.assign(income_copy=X_train['income'])       # uma cópia exata
X_test_d = X_test.assign(income_copy=X_test['income'])
forest_d = RandomForestRegressor(n_estimators=100, random_state=0, n_jobs=-1).fit(X_train_d, y_train)
pi_d = permutation_importance(forest_d, X_test_d, y_test, n_repeats=5, random_state=0)
print(pd.DataFrame({'MDI': forest_d.feature_importances_, 'perm. on test': pi_d.importances_mean},
                   index=X_train_d.columns).loc[['income', 'income_copy']].round(3))

order = rng.permutation(len(X_test_d))                           # embaralha as duas cópias do mesmo jeito
X_both = X_test_d.assign(income=X_test_d['income'].to_numpy()[order],
                         income_copy=X_test_d['income_copy'].to_numpy()[order])
print(f"both shuffled together: {forest_d.score(X_test_d, y_test) - forest_d.score(X_both, y_test):.3f}")
Sozinha, a renda tinha MDI de 0,516 e importância por permutação de 0,754. Com uma gêmea, a MDI cai à metade (0,262 + 0,259) e a importância por permutação de cada cópia cai para 0,196: quando se embaralha uma, as árvores que dividem pela outra cópia continuam funcionando. Juntas, valem 0,196 + 0,196 = 0,392, metade do que a informação vale. Embaralhar o par como grupo devolve 0,748. Dados reais estão cheios de quase gêmeos (cômodos e quartos aqui, raio e área de um tumor), então um atributo "inútil" pode apenas ter um substituto: embaralhe grupos correlacionados juntos.
Linhas impossíveis. Agora o mistério da latitude. Latitude e longitude têm correlação −0,92, porque a Califórnia é uma faixa diagonal. Embaralhe só a latitude e uma longitude de San Francisco recebe, digamos, uma latitude de San Diego: um ponto no Oceano Pacífico. Quantos dos distritos embaralhados caem onde não existe distrito nenhum?
from sklearn.neighbors import NearestNeighbors

map_ = NearestNeighbors(n_neighbors=1).fit(X[['latitude', 'longitude']])   # todos os distritos reais
X_perm = X_test.assign(latitude=rng.permutation(X_test['latitude'].to_numpy()))
dist, _ = map_.kneighbors(X_perm[['latitude', 'longitude']])
print(f"shuffled districts more than 0.25° from any real one: {(dist[:, 0] > 0.25).mean():.0%}")
45% das linhas embaralhadas ficam a mais de 0,25° (cerca de 25 km) de qualquer distrito real: no oceano ou no deserto. O modelo nunca viu lugares assim, então prevê o que as árvores extrapolarem e o R² desaba. Parte do 1,330 mede quanto a latitude importa; parte mede quão mal o modelo se comporta fora do mapa (Hooker, Mentch & Zhou, 2021). Com atributos fortemente correlacionados, a importância por permutação mistura as duas coisas. A correção, de novo, é tratar o par correlacionado como um atributo só, "localização".
Dependência parcial e ICE
O PDP, à mão
A importância diz quanto; não diz em que direção nem com que forma. O valor previsto cresce com a renda de forma constante ou satura? Friedman (2001) propôs o gráfico de dependência parcial (PDP): fixe o atributo num valor \(v\) em todas as linhas, mantenha o resto como está e tire a média das previsões:
É uma linha de pandas por valor:
from sklearn.inspection import partial_dependence

grid = np.array([1.5, 2, 3, 4, 5, 6, 8, 10])           # renda, em US$ 10.000
by_hand = [model.predict(X_test.assign(income=v)).mean() for v in grid]
print(np.round(by_hand, 1))

pdp = partial_dependence(model, X_test, ['income'], method='brute', custom_values={'income': grid})
print(pdp['average'][0].round(1))
Idênticos. Se todo distrito tivesse renda mediana de US$ 15.000, o modelo avaliaria o distrito médio em US$ 142.600; com US$ 100.000, em US$ 379.800. A curva é plana embaixo (de 1,5 para 2 soma só 8,0), sobe mais rápido entre 5 e 8 (+129,1) e volta a achatar acima de 8 (+21,2 de 8 para 10): parte desse achatamento vem do teto dos dados, já que toda casa acima de US$ 500.000 aparece registrada como US$ 500.001. (method='brute' é a definição acima. Para gradient boosting, o scikit-learn usa por padrão um atalho mais rápido, 'recursion', que percorre as árvores com as proporções dos dados de treino e devolve uma curva deslocada e um pouco diferente; peça 'brute' quando quiser a quantidade da definição.)
ICE: uma curva por linha
O PDP é uma média e, como toda média, pode esconder comportamentos opostos. Goldstein et al. (2015) propuseram manter as curvas individuais, uma por linha, antes da média: as curvas de expectativa condicional individual (ICE).
ice = partial_dependence(model, X_test, ['income'], kind='individual', method='brute',
                         custom_values={'income': grid})['individual'][0]
gain = ice[:, grid == 8][:, 0] - ice[:, grid == 2][:, 0]    # renda US$ 20 mil -> US$ 80 mil, distrito a distrito
print(f"PDP gain: {gain.mean():.0f}   ICE gains, 5th / 50th / 95th percentile: {np.percentile(gain, [5, 50, 95]).round(0)}")
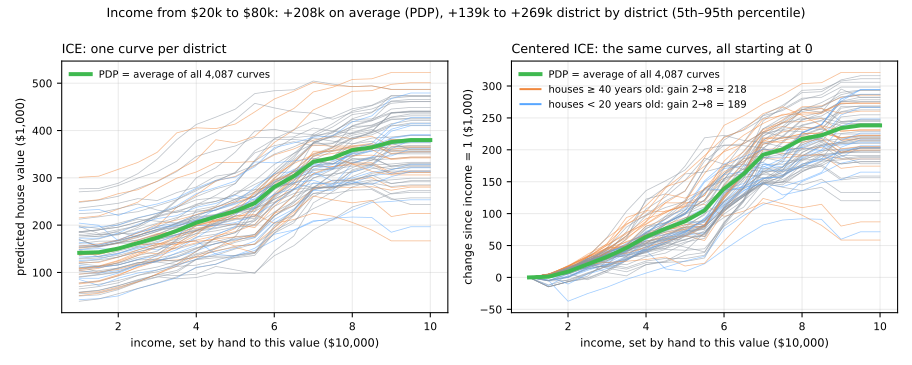
Subir a renda de US$ 20.000 para US$ 80.000 soma US$ 208.000 em média, mas o ganho distrito a distrito vai de US$ 139.000 a US$ 269.000 (percentis 5 a 95). À direita, as curvas ICE centradas começam todas em zero, o que deixa a dispersão visível: o modelo aprendeu interações, então o efeito da renda depende do resto da linha (as cores mostram uma delas: bairros mais antigos ganham mais). Quando as curvas ICE são paralelas, o PDP conta a história toda; quando se abrem em leque ou se cruzam, não conta. O scikit-learn desenha as duas coisas de uma vez:
import matplotlib.pyplot as plt
from sklearn.inspection import PartialDependenceDisplay

PartialDependenceDisplay.from_estimator(model, X_test, ['income', 'occupancy'], kind='both',
                                        subsample=100, random_state=0)
plt.show()
A armadilha da extrapolação
A fórmula do PDP tem o mesmo defeito da permutação: fixa um atributo em \(v\) em todas as linhas e mantém os outros, exista ou não essa combinação. Para a latitude, a dependência parcial em 33° pega todos os distritos (San Francisco inclusive) e os leva à latitude 33° sem mexer na longitude:
for lat in [33, 35, 37, 39, 41]:
    moved = X_test[['latitude', 'longitude']].assign(latitude=lat)
    dist, _ = map_.kneighbors(moved)
    print(f"latitude set to {lat}: {(dist[:, 0] > 0.25).mean():4.0%} of the rows land off the map")
latitude set to 33:  87% of the rows land off the map
latitude set to 35:  35% of the rows land off the map
latitude set to 37:  18% of the rows land off the map
latitude set to 39:  58% of the rows land off the map
latitude set to 41:  62% of the rows land off the map
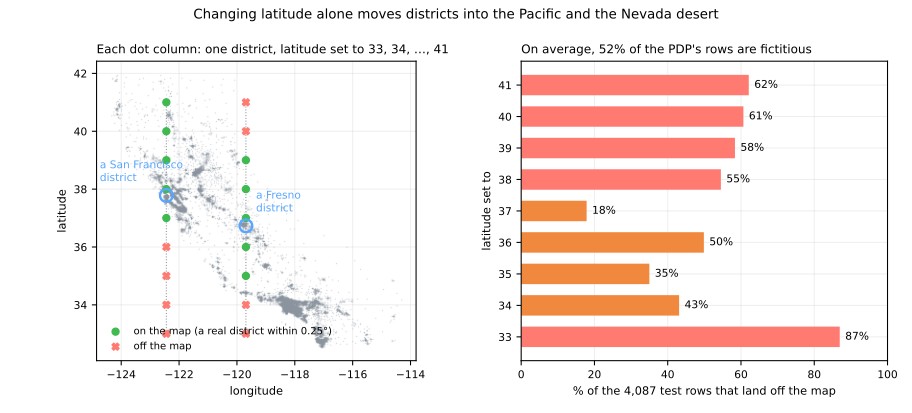
Na latitude 33°, 87% das linhas sobre as quais o PDP tira a média são distritos fictícios, a maioria no oceano; nas nove latitudes da figura, 52%. O valor que o gráfico mostra para 33° é, em grande parte, o palpite do modelo sobre lugares que não existem. Regras: olhe as curvas ICE e o alcance dos dados antes de confiar num PDP; não leia o PDP de um único atributo de um par fortemente correlacionado (desenhe o par junto, PartialDependenceDisplay.from_estimator(model, X, [('longitude', 'latitude')])); e saiba que os gráficos de efeitos locais acumulados (ALE) foram criados para evitar exatamente essa extrapolação (Apley & Zhu, 2020).
SHAP (local + global)
Etapa 3. Importância por permutação e PDP são globais. A pergunta que alguém afetado por uma decisão faz é local: por que esta previsão, para mim? O SHAP responde dividindo uma previsão em contribuições, uma por atributo, que somam exatamente:
em que \(\phi_0\) é a previsão média e \(\phi_j\) é a parcela do atributo \(j\) na diferença. As parcelas vêm da teoria dos jogos cooperativos: são valores de Shapley (Shapley, 1953). Lundberg & Lee (2017) mostraram como calculá-los para previsões de modelos.
Valores de Shapley à mão
Pense nos atributos como jogadores de um time e na previsão como o prêmio do time. O jogo precisa de um valor para toda coalizão \(S\) de jogadores: o que o modelo prevê quando conhece só os atributos de \(S\)? Um modelo não consegue "não conhecer" um atributo, então preenchemos os que faltam com um conjunto de fundo (background): fixamos os atributos de \(S\) nos valores da linha, deixamos as outras colunas como estão em cada linha do fundo e tiramos a média das previsões:
\(v(\varnothing)\) é a previsão média no fundo, o valor base; \(v(\text{todos})\) é a previsão da linha. O valor de Shapley de um atributo é sua contribuição marginal \(v(S \cup \{j\}) - v(S)\), na média sobre todas as coalizões em que ele poderia entrar, com os pesos que tornam igualmente prováveis todas as ordens de chegada dos jogadores:
Com \(d\) atributos há \(2^d\) coalizões, poucas o bastante para enumerar quando \(d\) é pequeno. A conta inteira cabe numa função:
from itertools import combinations
from math import factorial

def shapley(predict, x, background):
    """Valores de Shapley exatos da linha x, por força bruta sobre as 2^d coalizões."""
    names = list(x.index)
    d = len(names)
    v = {}                                                    # v[S] = valor da coalizão S
    for size in range(d + 1):
        for S in combinations(names, size):
            Z = background.assign(**{j: x[j] for j in S})    # atributos em S recebem os valores de x,
            v[S] = predict(Z).mean()                          # os demais mantêm os do fundo
    phi = pd.Series(0.0, index=names)
    for S, vS in v.items():
        for j in names:
            if j not in S:
                S_j = tuple(k for k in names if k in S or k == j)       # S ∪ {j}
                weight = factorial(len(S)) * factorial(d - len(S) - 1) / factorial(d)
                phi[j] += weight * (v[S_j] - vS)
    return phi, v
Comece por um modelo de brinquedo pequeno o bastante para uma calculadora: um preço (em US$ 1.000) a partir de três atributos sim/não, com uma interação: ser rico e litorâneo vale 40 a mais do que os dois separados.
O fundo tem quatro distritos; explicamos um distrito rico, litorâneo e não grande:
def toy_model(Z):                                   # preço em US$ 1.000
    return 100 + 80 * Z['rich'] + 60 * Z['coastal'] + 40 * Z['rich'] * Z['coastal'] + 20 * Z['big']

background_toy = pd.DataFrame({'rich':    [0, 1, 0, 0],
                               'coastal': [0, 0, 1, 0],
                               'big':     [1, 0, 0, 0]})
x_toy = pd.Series({'rich': 1, 'coastal': 1, 'big': 0})

phi, v = shapley(toy_model, x_toy, background_toy)
for S, value in v.items():
    print(f"v({{{', '.join(S)}}})".ljust(26), f"{value:6.1f}")
print(phi)
print(f"f(x) - v(empty) = {toy_model(x_toy) - v[()]:.1f} = sum of phi = {phi.sum():.1f}")
v({})                       140.0
v({rich})                   210.0
v({coastal})                195.0
v({big})                    135.0
v({rich, coastal})          285.0
v({rich, big})              205.0
v({coastal, big})           190.0
v({rich, coastal, big})     280.0
rich       80.0
coastal    65.0
big        -5.0
dtype: float64
f(x) - v(empty) = 140.0 = sum of phi = 140.0
Confira duas linhas à mão. Os quatro distritos do fundo valem 120, 180, 160 e 100, então \(v(\varnothing) = 140\). Para \(v(\{\text{rich}\})\), fixe rich = 1 nos quatro: 200, 180, 280, 180, média 210. Depois siga as setas azuis da figura:
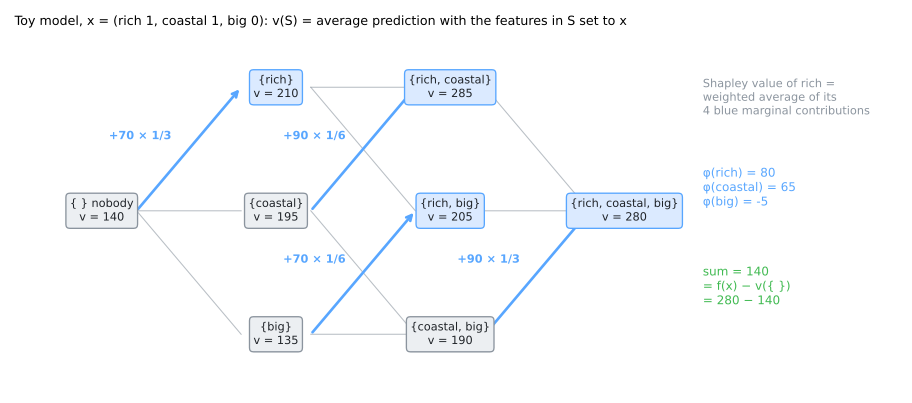
Tudo na saída faz sentido quando você conhece a fórmula. O efeito principal de rich é 80 × (1 − ¼) = 60, porque um distrito do fundo em cada quatro já é rico; o termo de interação, 40, é dividido igualmente entre os dois atributos que o criam, 20 para cada: 60 + 20 = 80 para rich e 45 + 20 = 65 para coastal. big recebe −5 = 20 × (0 − ¼): este distrito não é grande, enquanto um quarto do fundo é. E os três somam exatamente 280 − 140. Os valores de Shapley são a única atribuição com estas quatro propriedades (Shapley, 1953):
- eficiência: as contribuições somam previsão − valor base;
- simetria: dois atributos que contribuem igual para toda coalizão recebem o mesmo valor;
- nulidade (dummy): um atributo que nunca muda a previsão recebe 0;
- aditividade: para um modelo que é a soma de dois modelos (uma floresta, um ensemble com boosting), os valores são as somas dos valores.
Experimente no modelo de brinquedo. Clique numa ordem de chegada para seguir o caminho dela pelas coalizões; depois desligue coastal, ponha a interação em 0 ou 80 e confira a cascata a cada mudança:
A média das seis linhas é sempre o valor de Shapley, e a cascata sempre termina na previsão: os valores somam previsão − valor base, ligue o que ligar. A interação só dá crédito a rich e coastal, nunca a big; quando os dois valem 1, ela é dividida ao meio entre eles.
A biblioteca shap (pré-instalada no Colab; fora dele, pip install shap) precisa concordar. O TreeExplainer da biblioteca lê a estrutura de uma árvore; uma árvore ajustada nos oito cantos reproduz a fórmula exatamente:
import shap
from sklearn.tree import DecisionTreeRegressor

corners = pd.DataFrame([(r, c, b) for r in (0, 1) for c in (0, 1) for b in (0, 1)],
                       columns=['rich', 'coastal', 'big'])
toy_tree = DecisionTreeRegressor().fit(corners, toy_model(corners))   # reproduz a fórmula exatamente
explainer = shap.TreeExplainer(toy_tree, data=background_toy)
print(explainer.shap_values(x_toy.to_frame().T).round(2), explainer.expected_value)
No modelo de verdade
Agora o modelo de gradient boosting, 8 atributos: \(2^8 = 256\) coalizões, cada uma com a média sobre 100 distritos do fundo, 25.600 previsões ao todo. Tome um distrito de San Francisco e compare a força bruta com o TreeExplainer:
background = X_train.sample(100, random_state=0)
x = X_test.loc[5403]                                   # um distrito de San Francisco
phi, v = shapley(model.predict, x, background)

explainer = shap.TreeExplainer(model, data=background)
sv = explainer(x.to_frame().T)
print(pd.DataFrame({'value': x, 'phi by hand': phi, 'TreeExplainer': sv.values[0]}).round(2))
print(f"base value {v[()]:.2f} + sum of phi {phi.sum():.2f} = {v[()] + phi.sum():.2f}"
      f" = model.predict {model.predict(x.to_frame().T)[0]:.2f}")
print(f"largest difference, by hand vs TreeExplainer: {np.abs(phi - sv.values[0]).max():.0e}")
              value  phi by hand  TreeExplainer
income         3.39         2.62           2.62
house_age     52.00        34.24          34.24
rooms          3.77        -8.05          -8.05
bedrooms       1.06         3.60           3.60
population  1588.00         2.54           2.54
occupancy      1.98        66.34          66.34
latitude      37.78       -64.56         -64.56
longitude   -122.44       185.61         185.61
base value 207.39 + sum of phi 222.35 = 429.74 = model.predict 429.74
largest difference, by hand vs TreeExplainer: 2e-06
Os dois concordam até a sexta casa decimal. A força bruta não escalaria: com 20 atributos precisaria de um milhão de coalizões por linha. O TreeExplainer obtém os mesmos números exatos em tempo polinomial no tamanho das árvores, percorrendo cada árvore uma vez por linha (Lundberg et al., 2020); para modelos que não são árvores, o shap.KernelExplainer os estima sorteando coalizões. Chamado sem data, o TreeExplainer usa uma variante que preenche os atributos ausentes com as proporções de linhas de treino guardadas nas árvores; os números mudam um pouco, a regra da soma não.
A explicação do distrito, como uma cascata (waterfall), ao lado de um distrito de Fresno:
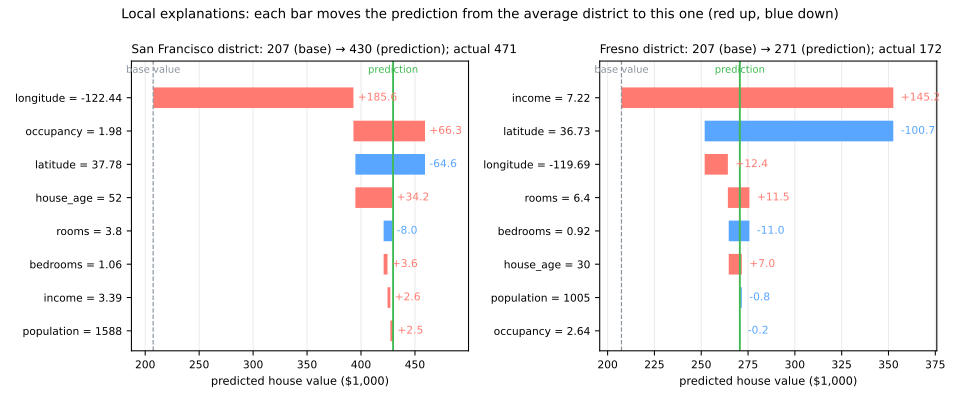
Leia a partir do valor base, US$ 207.000, a previsão média no fundo. Para o distrito de San Francisco, a localização é o que mais soma: longitude +185,6 e latitude −64,6. As duas são correlacionadas e o SHAP divide a localização entre elas de um jeito que não tem significado físico; pela aditividade, a soma, +121,0 para "localização", é o número com sentido. A ocupação baixa (1,98 pessoa por domicílio) soma 66,3 e as casas antigas somam 34,2. A renda, 3,39, é comum, então quase não contribui (+2,6). Em Fresno a história se inverte: uma renda alta (7,22) soma 145,2, enquanto a localização tira dinheiro (latitude −100,7, longitude +12,4: −88,3 para a localização). O mesmo atributo pode empurrar para cima numa linha e para baixo em outra; uma explicação local é sobre esta linha.
Global: explicações locais empilhadas
Explicar 300 distritos de teste dá uma tabela de 300 × 8 valores SHAP. O valor absoluto médio por coluna é uma importância global:
sample = X_test.sample(300, random_state=0)
sv = explainer(sample)                                  # 300 distritos x 8 atributos
mean_abs = pd.Series(np.abs(sv.values).mean(axis=0), index=X.columns)
print(mean_abs.sort_values(ascending=False).round(1))
shap.plots.beeswarm(sv)
latitude      76.6
longitude     64.1
income        44.2
occupancy     22.5
rooms         11.0
house_age      5.5
bedrooms       3.5
population     2.4
dtype: float64
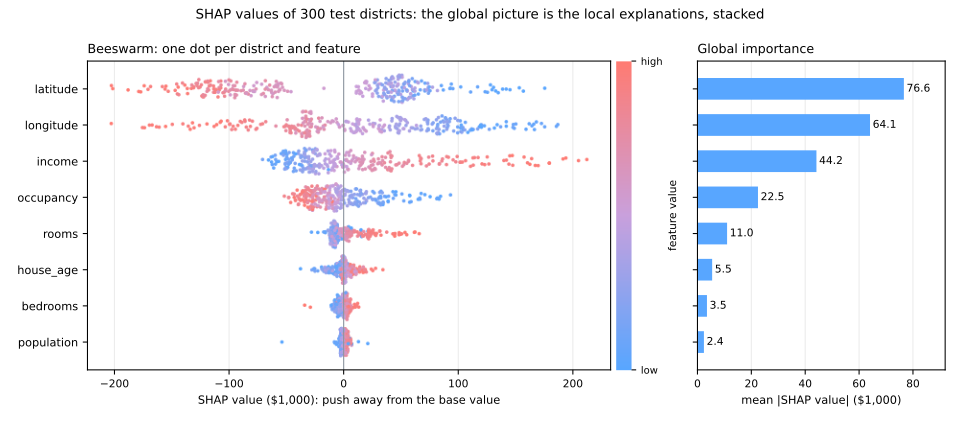
O beeswarm põe um ponto por distrito e atributo na posição do seu valor SHAP, colorido pelo valor do atributo. Ele mostra a direção além do tamanho: rendas altas (vermelho) ficam à direita, ocupações altas à esquerda, latitudes ao norte (vermelho) empurram os preços para baixo. O gráfico de barras é a tabela acima.
Três rankings globais do mesmo modelo agora discordam nos detalhes. A MDI pôs a renda em primeiro (0,567 da redução total de impureza); a permutação pôs a latitude em primeiro, com uma queda de R² maior que 1, inflada por linhas impossíveis; a média de |SHAP| põe a latitude em primeiro, 76,6 contra 44,2 da renda, mas em US$ 1.000 de previsão, não em R². Eles respondem a perguntas diferentes: o que o treino usou?, de que o escore precisa?, quanto cada atributo move as previsões? Escolha a pergunta antes do método.
LIME
O SHAP precisa de um valor para cada coalizão. O LIME (Ribeiro, Singh & Guestrin, 2016) pergunta algo mais simples: na vizinhança desta linha, qual modelo linear imita melhor a caixa-preta? Os coeficientes dele são a explicação. A receita para dados tabulares tem quatro passos:
- perturbar: sortear milhares de pontos em volta da linha, somando ruído a cada atributo;
- prever: perguntar à caixa-preta sobre cada um deles;
- ponderar: quanto mais perto da linha, mais peso, por meio de um kernel de largura \(w\);
- ajustar um modelo linear ponderado a essas previsões.
Cada passo é uma ou duas linhas:
from sklearn.linear_model import Ridge

def lime_by_hand(predict, x, X_ref, n=5000, width=None, seed=0):
    """LIME para dados tabulares: perturba x, pondera por proximidade, ajusta um modelo linear ponderado."""
    rng = np.random.default_rng(seed)
    scale = X_ref.std(ddof=0).to_numpy()
    steps = rng.normal(size=(n, len(x)))                           # perturbações, em desvios padrão
    Z = pd.DataFrame(x.to_numpy() + steps * scale, columns=x.index)
    width = width or 0.75 * np.sqrt(len(x))                        # largura padrão do kernel do LIME
    weight = np.sqrt(np.exp(-(steps ** 2).sum(axis=1) / width ** 2))   # perto = pesado
    surrogate = Ridge(alpha=1).fit(steps, predict(Z), sample_weight=weight)
    return pd.Series(surrogate.coef_, index=x.index)          # mil US$ por desvio padrão

print(lime_by_hand(model.predict, x, X_train).round(1))
income        42.1
house_age      1.3
rooms          2.8
bedrooms       3.0
population     3.3
occupancy    -49.9
latitude     -89.3
longitude    -53.6
dtype: float64
O pacote lime (pip install lime), com suas opções para atributos contínuos, faz o mesmo com seus próprios sorteios:
from lime.lime_tabular import LimeTabularExplainer      # pip install lime

lt = LimeTabularExplainer(X_train.to_numpy(), feature_names=list(X.columns), mode='regression',
                          discretize_continuous=False, sample_around_instance=True, random_state=0)
exp = lt.explain_instance(x.to_numpy(), lambda A: model.predict(pd.DataFrame(A, columns=X.columns)),
                          num_features=8, num_samples=5000)
print(pd.Series(dict(exp.as_list()))[X.columns].round(1))
income        42.0
house_age      3.5
rooms          2.5
bedrooms       2.1
population     5.1
occupancy    -48.9
latitude     -91.8
longitude    -55.5
dtype: float64
A mesma história, a poucas unidades de distância: em volta deste distrito de San Francisco, um desvio padrão a mais de renda (US$ 19.000) soma cerca de US$ 42.000 e um desvio padrão para o norte (2,1°) tira cerca de US$ 90.000. (Por padrão a biblioteca faz algo mais grosseiro: corta cada atributo nos quartis e explica com regras como "renda entre o primeiro e o segundo quartil".)
Compare com o SHAP para o mesmo distrito: a renda recebeu +2,6 lá e +42,1 por desvio padrão aqui. Os dois estão certos, porque respondem a perguntas diferentes. O SHAP pergunta quanto a renda real deste distrito afasta sua previsão da do distrito médio; a renda é comum, então afasta pouco. O LIME pergunta o que aconteceria se a renda mudasse: a inclinação local, que é íngreme. Pergunte "por que esta casa é cara?" e o SHAP responde; pergunte "o que mudaria o preço?" e o LIME responde. (Os dois também são mais próximos do que parecem: o KernelSHAP de Lundberg & Lee é o LIME rodado sobre coalizões, atributos ligados ou desligados, com um kernel específico e sem regularização; essa escolha faz a regressão ponderada devolver valores de Shapley.)
O ponto fraco do LIME é a palavra "em volta". Quão longe é local?
table = pd.DataFrame({f'width {w}': lime_by_hand(model.predict, x, X_train, width=w)
                      for w in [0.5, 1.0, 2.12, 5.0]})
table['std, 5 seeds'] = pd.DataFrame([lime_by_hand(model.predict, x, X_train, seed=s)
                                      for s in range(5)]).std()
print(table.round(1))
            width 0.5  width 1.0  width 2.12  width 5.0  std, 5 seeds
income           54.7       54.8        42.1       38.2           1.5
house_age        -9.9        1.3         1.3        1.0           1.3
rooms           -11.2       -0.3         2.8        3.7           0.9
bedrooms          5.9        8.9         3.0        1.4           1.0
population        6.9        3.5         3.3        3.9           1.7
occupancy       -71.0      -67.4       -49.9      -45.0           0.9
latitude        -80.4      -99.3       -89.3      -86.8           0.7
longitude       -67.8      -64.8       -53.6      -50.1           1.6
Com 5.000 amostras, os sorteios pesam pouco (desvios padrão de 0,7 a 1,7 entre 5 sementes). A largura do kernel pesa muito: a inclinação da renda vai de 54,7 a 38,2, a da ocupação, de −71,0 a −45,0; house_age chega a trocar de sinal. O padrão, \(0{,}75\sqrt{d} = 2{,}12\), é uma convenção, não uma lei. A figura mostra por quê, com um LIME de um atributo só: a curva do modelo é uma escada: uma vizinhança estreita vê só o degrau íngreme ao lado da linha, enquanto uma larga vê a tendência inteira.
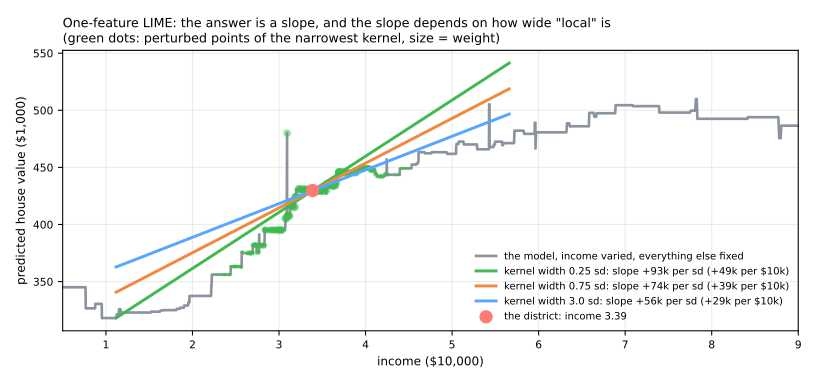
Mais dois cuidados. As perturbações movem cada atributo de forma independente, então o LIME, como a permutação e o PDP, pergunta ao modelo sobre distritos no oceano. E o ruído somado a cada atributo é um desvio padrão inteiro do conjunto de dados, então "local" cobre boa parte da Califórnia. A força do LIME é sua generalidade: a mesma receita explica imagens (ligando e desligando superpixels) e textos (removendo palavras), que é onde ele mais é usado.
Lendo explicações com responsabilidade
Etapa 4. Todos os métodos acima produziram números; esta seção trata do que esses números podem e não podem afirmar.
Explicação ≠ causalidade
Uma explicação descreve o modelo, não o mundo. "Em volta do distrito de San Francisco, um desvio padrão a mais de ocupação reduz o preço previsto em cerca de US$ 50.000" (a inclinação do LIME, −49,9) é uma afirmação verdadeira sobre as árvores do boosting. Não quer dizer que pôr mais gente numa casa a deixa mais barata: domicílios lotados são um marcador de bairros mais pobres e o modelo usa esse marcador. A mesma lógica torna as explicações úteis para auditoria: se a explicação de um modelo de crédito se apoia no CEP, o modelo pode estar usando o CEP como proxy de renda ou de raça. Para afirmar que um atributo causa um resultado, você precisa de experimentos ou de inferência causal, não de SHAP.
Um modelo pode acertar pelos motivos errados. Ribeiro et al. (2016) treinaram um classificador para distinguir lobos de huskies; o LIME mostrou que ele olhava a neve do fundo. Zech et al. (2018) encontraram modelos de raio X de tórax que reconheciam de qual hospital vinha a imagem, um forte preditor de doença nos dados deles. O padrão é fácil de reproduzir. No hospital A, pacientes graves demais para ficar de pé são examinados com um aparelho portátil, então o tipo de aparelho acompanha o diagnóstico; no hospital B, os aparelhos são atribuídos ao acaso:
from sklearn.ensemble import GradientBoostingClassifier

def hospital(n, shortcut, seed):
    rng = np.random.default_rng(seed)
    sick = rng.integers(0, 2, n)
    X = pd.DataFrame({f'marker_{k}': 0.8 * sick + rng.normal(size=n) for k in (1, 2, 3)})
    # com probabilidade `shortcut`, o tipo de aparelho copia o diagnóstico
    X['portable_scanner'] = np.where(rng.random(n) < shortcut, sick, rng.integers(0, 2, n))
    return X, sick

X_a, y_a = hospital(3000, shortcut=0.9, seed=1)     # hospital A: os doentes vão para o aparelho portátil
X_b, y_b = hospital(3000, shortcut=0.0, seed=2)     # hospital B: aparelho atribuído ao acaso
X_a_tr, X_a_va, y_a_tr, y_a_va = train_test_split(X_a, y_a, test_size=0.3, random_state=0)

clf = GradientBoostingClassifier(random_state=0).fit(X_a_tr, y_a_tr)
pi = permutation_importance(clf, X_a_va, y_a_va, n_repeats=5, random_state=0)
print(pd.Series(pi.importances_mean, index=X_a.columns).round(3))
print(f"accuracy on hospital A (validation): {clf.score(X_a_va, y_a_va):.3f} · on hospital B: {clf.score(X_b, y_b):.3f}")

markers = ['marker_1', 'marker_2', 'marker_3']
honest = GradientBoostingClassifier(random_state=0).fit(X_a_tr[markers], y_a_tr)
print(f"markers only:  hospital A {honest.score(X_a_va[markers], y_a_va):.3f} · hospital B {honest.score(X_b[markers], y_b):.3f}")
marker_1            0.006
marker_2            0.006
marker_3            0.012
portable_scanner    0.393
dtype: float64
accuracy on hospital A (validation): 0.934 · on hospital B: 0.538
markers only:  hospital A 0.730 · hospital B 0.747
Numa validação do hospital A o modelo parece excelente, 93,4%; no hospital B ele mal passa de uma moeda, 53,8%. Nenhuma validação no hospital A poderia ter avisado, porque lá o atalho é real. A explicação avisou: a importância por permutação do aparelho, 0,393, esmaga todos os marcadores médicos (0,012 no máximo). A explicação estava correta (o modelo depende mesmo do aparelho); só o conhecimento do domínio pode dizer que essa dependência não vai sobreviver. O modelo feito só com os marcadores é pior no A (73,0%) e melhor onde importa, no B (74,7%).
Explicações são estimativas, com escolhas dentro. Esta aula mediu várias: o conjunto de fundo define o valor base do SHAP; a largura do kernel muda as inclinações do LIME; atributos correlacionados dividem o crédito de forma arbitrária (latitude e longitude; a renda e sua cópia); permutação e PDP consultam linhas impossíveis. Explicações podem até ser manipuladas: Slack et al. (2020) construíram modelos que discriminam nas entradas reais enquanto mostram explicações inocentes ao LIME e ao SHAP, que os sondam com pontos fora da distribuição. Trate uma explicação como uma evidência a ser checada, não como um certificado.
Um checklist para explicar um modelo
- Tente primeiro um modelo interpretável; se ele for tão bom quanto (compare nos mesmos folds), use-o. 2. Calcule importâncias em dados separados. 3. Procure grupos correlacionados e embaralhe ou explique esses grupos juntos. 4. Olhe as curvas ICE (não só o PDP) e confira se os valores do gráfico estão dentro dos dados. 5. Use SHAP para explicações locais; informe o fundo que você usou. 6. Quando um atributo domina, pergunte quando esse valor é registrado? antes de comemorar (vazamento). 7. Nunca leia uma explicação como uma afirmação causal.
Lab: explicando decisões de crédito
Um banco precisa explicar as próprias decisões: ao solicitante recusado que pergunta, por lei; a si mesmo, por prudência. Os dados são o clássico German credit (Hofmann, 1994): 1.000 empréstimos, 20 atributos do solicitante e do empréstimo e o desfecho: se o empréstimo deu errado (30% deram). Você vai comparar um scorecard interpretável com uma random forest e depois abrir a floresta com todas as ferramentas desta aula: importâncias, dependência parcial, SHAP (global e para um solicitante) e, por fim, plantar um vazamento e ver as explicações o encontrarem.
Rode os blocos em ordem, numa mesma sessão (cerca de um minuto). Para trabalhar direto nele, baixe o notebook do lab e abra no Jupyter ou no Colab (Arquivo → Fazer upload de notebook). Ele usa o shap, que o Colab costuma ter pré-instalado; se import shap falhar, rode %pip install shap numa célula.
Passo 1 — carregar os solicitantes
import numpy as np
import pandas as pd
from sklearn.datasets import fetch_openml

credit = fetch_openml(data_id=31, as_frame=True)        # German credit: 1.000 solicitantes de crédito
raw = credit.data                                       # 7 colunas numéricas + 13 categóricas
y = (credit.target == 'bad').astype(int)                # 1 = o empréstimo deu errado
cat_cols = list(raw.select_dtypes('category').columns)
X = raw.copy()
X[cat_cols] = X[cat_cols].apply(lambda c: c.cat.codes)  # cada categoria -> um código inteiro
X = X.astype(float)
print(X.shape, f"bad loans: {y.sum()} ({y.mean():.0%})")
print(raw[['checking_status', 'duration', 'credit_amount', 'purpose', 'age']].head(3))
(1000, 20) bad loans: 300 (30%)
  checking_status  duration  credit_amount    purpose  age
0              <0         6           1169   radio/tv   67
1        0<=X<200        48           5951   radio/tv   22
2     no checking        12           2096  education   49
Cada linha é um solicitante: o saldo da conta corrente (checking_status, em marcos alemães), a duração do empréstimo em meses e o valor, a finalidade, a idade do solicitante e mais 15 colunas (poupança, emprego, moradia, personal_status — que mistura sexo e estado civil — e assim por diante). As categorias viram códigos inteiros, que as árvores tratam bem; raw guarda os valores legíveis para depois.
Passo 2 — scorecard ou floresta? Mesmos folds
from sklearn.compose import make_column_transformer
from sklearn.dummy import DummyClassifier
from sklearn.ensemble import RandomForestClassifier
from sklearn.linear_model import LogisticRegression
from sklearn.model_selection import StratifiedKFold, cross_val_score, train_test_split
from sklearn.pipeline import make_pipeline
from sklearn.preprocessing import OneHotEncoder, StandardScaler

X_dev, X_test, y_dev, y_test = train_test_split(X, y, test_size=0.2, stratify=y, random_state=42)
cv = StratifiedKFold(n_splits=5, shuffle=True, random_state=42)

scorecard = make_pipeline(
    make_column_transformer((OneHotEncoder(handle_unknown='ignore'), cat_cols), remainder=StandardScaler()),
    LogisticRegression(max_iter=1000))
candidates = {'dummy': DummyClassifier(),
              'logistic regression': scorecard,
              'random forest': RandomForestClassifier(n_estimators=300, min_samples_leaf=5,
                                                      random_state=42, n_jobs=-1)}
auc = {}
for name, m in candidates.items():
    auc[name] = cross_val_score(m, X_dev, y_dev, cv=cv, scoring='roc_auc')
    print(f"{name:20s} ROC AUC {auc[name].mean():.3f} ± {auc[name].std():.3f}")
d = auc['random forest'] - auc['logistic regression']
print(f"forest - logistic, fold by fold: {d.round(3)}  ->  {d.mean():+.3f} ± {d.std():.3f}")
dummy                ROC AUC 0.500 ± 0.000
logistic regression  ROC AUC 0.771 ± 0.053
random forest        ROC AUC 0.785 ± 0.043
forest - logistic, fold by fold: [ 0.01  -0.027  0.016  0.03   0.041]  ->  +0.014 ± 0.023
Como ler: o conjunto de teste (200 solicitantes) fica trancado e os dois modelos são avaliados nos mesmos cinco folds, como na aula de validação cruzada. A floresta está à frente por 0,014 de ROC AUC, mas a diferença por fold tem dispersão de 0,023 e troca de sinal: pela regra daquela aula, um empate. É o argumento de Rudin na prática: neste problema, uma regressão logística, cujos coeficientes one-hot um regulador consegue ler linha a linha, é tão boa quanto a caixa-preta. Um banco de verdade deveria colocar o scorecard em produção. Seguimos com a floresta porque é o modelo que você vai enfrentar quando a diferença for real e porque podemos verificar se as explicações dela fazem sentido.
Passo 3 — ajustar a floresta, testar uma vez
from sklearn.metrics import roc_auc_score

forest = candidates['random forest'].fit(X_dev, y_dev)
risk = forest.predict_proba(X_test)[:, 1]                # probabilidade prevista de o empréstimo dar errado
print(f"test ROC AUC: {roc_auc_score(y_test, risk):.3f}")
O único teste: 0,798, dentro da estimativa da CV de 0,785 ± 0,043. Daqui em diante, os 200 solicitantes de teste servem para explicar o modelo, não para escolher nada nele.
Passo 4 — MDI contra importância por permutação
from sklearn.inspection import permutation_importance

perm = permutation_importance(forest, X_test, y_test, scoring='roc_auc', n_repeats=10, random_state=42)
imp = pd.DataFrame({'MDI': forest.feature_importances_,
                    'perm. (AUC drop)': perm.importances_mean,
                    'perm. std': perm.importances_std}, index=X.columns)
imp['MDI rank'] = imp['MDI'].rank(ascending=False).astype(int)
print(imp.sort_values('perm. (AUC drop)', ascending=False).head(8).round(3))
                          MDI  perm. (AUC drop)  perm. std  MDI rank
checking_status         0.179             0.141      0.036         1
duration                0.121             0.036      0.013         3
credit_amount           0.133             0.021      0.008         2
purpose                 0.050             0.012      0.006         7
credit_history          0.057             0.010      0.006         5
age                     0.089             0.009      0.006         4
savings_status          0.053             0.005      0.011         6
installment_commitment  0.043             0.004      0.005         8
Como ler: os dois métodos põem checking_status em primeiro; pela permutação, ele está sozinho no topo: embaralhá-lo custa 0,141 de AUC, quatro vezes o atributo seguinte. Abaixo disso os rankings se separam, na direção que as aulas de árvores de decisão e de random forest previam. credit_amount e age, colunas com muitos valores distintos, são 2º e 4º pela MDI mas custam só 0,021 e 0,009 quando embaralhados: muitos valores distintos atraem divisões nas linhas de treino. Repare também nos desvios padrão: da 5ª linha para baixo, as quedas estão a cerca de um ou dois desvios padrão de zero, então a ordem entre elas diz pouco.
Passo 5 — dependência parcial e ICE
import matplotlib.pyplot as plt
from sklearn.inspection import PartialDependenceDisplay, partial_dependence

PartialDependenceDisplay.from_estimator(forest, X_test, ['duration', 'credit_amount'], kind='both',
                                        subsample=100, random_state=42)
plt.show()

for f in ['duration', 'credit_amount']:
    grid = np.percentile(X_dev[f], [5, 25, 50, 75, 95])
    pdp = partial_dependence(forest, X_test, [f], method='brute', custom_values={f: grid})
    print(f"{f:14s}", '  '.join(f"{g:>6.0f}: {p:.3f}" for g, p in zip(grid, pdp['average'][0])))
duration            6: 0.223      12: 0.272      18: 0.328      24: 0.344      48: 0.415
credit_amount     701: 0.326    1353: 0.305    2317: 0.291    3933: 0.299    8615: 0.375
Como ler: os valores impressos são o PDP nos percentis 5, 25, 50, 75 e 95 de cada atributo. Empréstimos mais longos são mais arriscados, de forma constante: o risco previsto médio vai de 0,223 para um empréstimo de 6 meses a 0,415 para um de 48. O valor tem forma de U: os menores empréstimos (0,326) e os maiores (0,375) são mais arriscados que o mediano (0,291). No gráfico, olhe as curvas ICE: elas correm paralelas ao PDP ou alguns solicitantes reagem de outro jeito? E lembre da armadilha da extrapolação: duração e valor são correlacionados (empréstimos longos tendem a ser grandes), então um empréstimo de 6 meses de 8.615 marcos é uma combinação que o modelo raramente viu.
Passo 6 — SHAP: o quadro global
import shap                  # pré-instalado no Colab; fora dele: pip install shap

background = X_dev.sample(100, random_state=42)
explainer = shap.TreeExplainer(forest, data=background)
sv = explainer(X_test)[:, :, 1]                          # classe 1 (empréstimo ruim), em unidades de probabilidade
print(f"base value: {sv.base_values[0]:.3f}")
mean_abs = pd.Series(np.abs(sv.values).mean(axis=0), index=X.columns).sort_values(ascending=False)
print(mean_abs.head(8).round(3))
shap.plots.beeswarm(sv)
base value: 0.305
checking_status           0.090
duration                  0.049
savings_status            0.031
credit_amount             0.025
personal_status           0.021
credit_history            0.020
other_payment_plans       0.016
installment_commitment    0.016
dtype: float64
Como ler: para um classificador random forest, os valores SHAP estão em unidades de probabilidade de empréstimo ruim. O valor base, 0,305, é o risco médio previsto pela floresta para os 100 solicitantes do fundo. Em média, checking_status move o risco de um solicitante em 9,0 pontos, duration em 4,9. O topo do ranking concorda com a importância por permutação, com uma novidade marcante: personal_status, 5º pelo SHAP. No beeswarm, lembre que as cores das colunas categóricas são códigos inteiros, então "alto" e "baixo" não significam nada para elas; olhe a dispersão.
Passo 7 — um solicitante, uma explicação
i = int(np.argmax(risk))                                 # o solicitante mais arriscado do conjunto de teste
who = X_test.index[i]
print(f"applicant {who}: predicted risk {risk[i]:.3f} · actual outcome: {'bad' if y_test.iloc[i] else 'good'}")
reasons = pd.DataFrame({'value': raw.loc[who].astype(str), 'SHAP': sv.values[i]})
print(reasons.sort_values('SHAP', key=abs, ascending=False).head(6).round(3))
print(f"base {sv.base_values[i]:.3f} + sum of SHAP {sv.values[i].sum():+.3f} = "
      f"{sv.base_values[i] + sv.values[i].sum():.3f}  (model: {risk[i]:.3f})")
shap.plots.waterfall(sv[i])
applicant 11: predicted risk 0.710 · actual outcome: bad
                              value   SHAP
duration                         48  0.114
checking_status                  <0  0.114
savings_status                 <100  0.045
personal_status  female div/dep/mar  0.033
age                              24  0.021
credit_history        existing paid  0.020
base 0.305 + sum of SHAP +0.404 = 0.710  (model: 0.710)
Como ler: esta é a carta de recusa que a lei pede. O risco previsto do solicitante é 0,710; a propriedade de eficiência vale até a terceira casa: 0,305 + 0,404 = 0,710. Os motivos principais são um empréstimo de 48 meses (+11,4 pontos), uma conta corrente no vermelho (+11,4), poupança abaixo de 100 marcos (+4,5) e, em quarto lugar, ser uma mulher divorciada, separada ou casada (+3,3), depois ter 24 anos (+2,1). Os três primeiros são motivos que um banco consegue defender. O quarto e o quinto são características protegidas na maioria das leis antidiscriminação. A explicação cumpriu o papel dela: tornou visível algo que o AUC jamais mostraria.
Passo 8 — o modelo precisa de personal_status?
without = cross_val_score(candidates['random forest'], X_dev.drop(columns='personal_status'), y_dev,
                          cv=cv, scoring='roc_auc')
d = without - auc['random forest']
print(f"permutation importance of personal_status: {imp.loc['personal_status', 'perm. (AUC drop)']:.3f}")
print(f"without personal_status: ROC AUC {without.mean():.3f} · difference {d.mean():+.3f} ± {d.std():.3f}")
print(f"applicants whose risk personal_status moves by more than 0.02: "
      f"{(np.abs(sv[:, 'personal_status'].values) > 0.02).mean():.0%}")
permutation importance of personal_status: -0.001
without personal_status: ROC AUC 0.781 · difference -0.004 ± 0.005
applicants whose risk personal_status moves by more than 0.02: 50%
Como ler: pela permutação, personal_status não vale nada para o escore (−0,001); retreinar sem ele muda o AUC da CV em −0,004 ± 0,005, um empate. Mesmo assim, ele move o risco previsto de metade dos solicitantes de teste em mais de 2 pontos. A importância por permutação pergunta se o ranking precisa de um atributo; o SHAP pergunta se as previsões o usam. Para a justiça, a segunda pergunta é a que importa: um atributo pode ser inútil para a acurácia e ainda assim decidir quem recebe um empréstimo. Tirar a coluna é a parte fácil; a auditoria mais difícil é saber se outras colunas funcionam como proxy dela (uma questão para a "Sua vez").
Passo 9 — plantar um vazamento, ver as explicações o encontrarem
rng = np.random.default_rng(42)
letters = rng.poisson(np.where(y == 1, 2.0, 0.3))        # cartas de cobrança: enviadas DEPOIS que o empréstimo dá errado
X_leak = X.assign(collection_letters=letters)
X_dev_l, X_test_l = X_leak.loc[X_dev.index], X_leak.loc[X_test.index]

leaky = RandomForestClassifier(n_estimators=300, min_samples_leaf=5, random_state=42, n_jobs=-1)
auc_leak = cross_val_score(leaky, X_dev_l, y_dev, cv=cv, scoring='roc_auc')
leaky.fit(X_dev_l, y_dev)
perm_l = permutation_importance(leaky, X_test_l, y_test, scoring='roc_auc', n_repeats=10, random_state=42)
sv_l = shap.TreeExplainer(leaky, data=X_dev_l.sample(100, random_state=42))(X_test_l)[:, :, 1]
print(f"CV ROC AUC: {auc['random forest'].mean():.3f} -> {auc_leak.mean():.3f}")
print(pd.DataFrame({'perm. (AUC drop)': perm_l.importances_mean,
                    'mean |SHAP|': np.abs(sv_l.values).mean(axis=0)},
                   index=X_leak.columns).sort_values('mean |SHAP|', ascending=False).head(4).round(3))
CV ROC AUC: 0.785 -> 0.927
                    perm. (AUC drop)  mean |SHAP|
collection_letters             0.209        0.154
checking_status                0.052        0.067
duration                       0.015        0.027
savings_status                 0.002        0.020
Como ler: uma coluna que conta cartas de cobrança existe no banco de dados do banco, mas as cartas só são enviadas depois que um empréstimo dá errado, o "atributo que conhece o futuro" da aula de validação cruzada. A validação cruzada não o pega: o AUC da CV salta de 0,785 para 0,927 e o conjunto de teste concordaria, porque o vazamento está em todas as linhas. As explicações o pegam na hora. collection_letters é o primeiro pelos dois métodos, com uma queda por permutação quatro vezes a de checking_status (0,209 contra 0,052) e uma média de |SHAP| de 0,154, mais que o dobro da do antigo líder. Um atributo novo que pesa mais do que tudo o que um analista de crédito conhece deveria disparar uma pergunta: quando esse valor é registrado?
Sua vez
- LIME para o solicitante 11. Adapte a
lime_by_handda aula à floresta (predict = lambda Z: forest.predict_proba(Z)[:, 1]). Perturbar um código inteiro de categoria por uma fração de desvio padrão não faz sentido: perturbe só as 7 colunas numéricas e mantenha as categóricas fixas. As inclinações locais concordam em sinal com os valores SHAP do passo 7? - Scorecard contra floresta. Ajuste o
scorecarddo passo 2 emX_deve liste os 10 maiores coeficientes (os nomes one-hot vêm descorecard[0].get_feature_names_out()). O scorecard e o ranking SHAP da floresta concordam nos principais motivos? Qual dos dois você preferiria defender diante de um regulador? - Agrupe os valores SHAP. Valores SHAP somam, então a contribuição de um grupo é a soma dos seus membros. Calcule, para cada solicitante de teste, a contribuição de "liquidez"
checking_status + savings_statuse compare a média de |SHAP| dessa contribuição com a deduration. - Proxies. Tire
personal_status, reajuste e recalcule os valores SHAP do solicitante 11. Quais atributos absorvem a contribuição dele? Depois treine um classificador para preverpersonal_statusa partir das outras 19 colunas: se ele for muito melhor que a classe majoritária, as outras colunas carregam a informação e tirar a coluna não a removeu.
Material de aula
Notebook do lab
O lab desta aula como notebook, pronto para o Jupyter ou o Colab: notebook do lab.
Referências
- Breiman, L. "Random Forests." Machine Learning 45 (2001): 5–32 — a importância por permutação, introduzida para florestas com dados out-of-bag. DOI
- Friedman, J. H. "Greedy Function Approximation: A Gradient Boosting Machine." Annals of Statistics 29, no. 5 (2001): 1189–1232 — o gráfico de dependência parcial (seção 8.2). DOI
- Goldstein, A.; Kapelner, A.; Bleich, J.; Pitkin, E. "Peeking Inside the Black Box: Visualizing Statistical Learning with Plots of Individual Conditional Expectation." Journal of Computational and Graphical Statistics 24, no. 1 (2015): 44–65 — as curvas ICE. DOI
- Shapley, L. S. "A Value for n-Person Games." Em Contributions to the Theory of Games II, Annals of Mathematics Studies 28, Princeton University Press (1953): 307–317. DOI
- Lundberg, S. M.; Lee, S.-I. "A Unified Approach to Interpreting Model Predictions." Advances in Neural Information Processing Systems 30 (NeurIPS 2017): 4765–4774 — SHAP e KernelSHAP. arXiv:1705.07874
- Lundberg, S. M.; Erion, G.; Chen, H.; DeGrave, A.; Prutkin, J. M.; Nair, B.; Katz, R.; Himmelfarb, J.; Bansal, N.; Lee, S.-I. "From Local Explanations to Global Understanding with Explainable AI for Trees." Nature Machine Intelligence 2 (2020): 56–67 — TreeSHAP. DOI
- Ribeiro, M. T.; Singh, S.; Guestrin, C. ""Why Should I Trust You?": Explaining the Predictions of Any Classifier." Proceedings of the 22nd ACM SIGKDD (KDD 2016): 1135–1144 — o LIME e o husky que era um detector de neve. DOI
- Molnar, C. Interpretable Machine Learning: A Guide for Making Black Box Models Explainable. Livro online, 2ª ed. (2022) — todos os métodos desta aula e outros. christophm.github.io/interpretable-ml-book
- Strobl, C.; Boulesteix, A.-L.; Zeileis, A.; Hothorn, T. "Bias in Random Forest Variable Importance Measures: Illustrations, Sources and a Solution." BMC Bioinformatics 8 (2007): 25. DOI
- Hooker, G.; Mentch, L.; Zhou, S. "Unrestricted Permutation Forces Extrapolation: Variable Importance Requires at Least One More Model, or There Is No Free Variable Importance." Statistics and Computing 31 (2021): 82. DOI
- Apley, D. W.; Zhu, J. "Visualizing the Effects of Predictor Variables in Black Box Supervised Learning Models." Journal of the Royal Statistical Society B 82, no. 4 (2020): 1059–1086 — os gráficos ALE. DOI
- Rudin, C. "Stop Explaining Black Box Machine Learning Models for High Stakes Decisions and Use Interpretable Models Instead." Nature Machine Intelligence 1 (2019): 206–215. DOI
- Zech, J. R.; Badgeley, M. A.; Liu, M.; Costa, A. B.; Titano, J. J.; Oermann, E. K. "Variable Generalization Performance of a Deep Learning Model to Detect Pneumonia in Chest Radiographs: A Cross-Sectional Study." PLOS Medicine 15, no. 11 (2018): e1002683. DOI
- Slack, D.; Hilgard, S.; Jia, E.; Singh, S.; Lakkaraju, H. "Fooling LIME and SHAP: Adversarial Attacks on Post hoc Explanation Methods." Proceedings of the AAAI/ACM Conference on AI, Ethics, and Society (AIES 2020): 180–186. DOI
- Hofmann, H. "Statlog (German Credit Data)." UCI Machine Learning Repository (1994) — os dados do lab (OpenML 31). DOI
- Pace, R. K.; Barry, R. "Sparse Spatial Autoregressions." Statistics & Probability Letters 33, no. 3 (1997): 291–297 — os dados do California housing. DOI
- Brasil. Lei nº 13.709, de 14 de agosto de 2018 — Lei Geral de Proteção de Dados Pessoais (LGPD), art. 20. planalto.gov.br
- SHAP — explicabilidade de modelos.