e. Grafana
Grafana connects to Prometheus as a datasource and provides rich, interactive dashboards for visualizing the collected metrics.
Create the datasource provisioning file at setup/grafana/provisioning/datasources/datasources.yml:
| datasources.yml | |
|---|---|
Grafana loads this file automatically on startup, connecting it to the Prometheus instance on the internal Docker network — no manual UI configuration needed.
Once the stack is running, open Grafana in the browser:
Login with the default credentials:
| Field | Value |
|---|---|
| Username | admin |
| Password | admin |
Dashboard Marketplace
Grafana provides a large library of pre-built dashboards for common stacks. For Spring Boot and Micrometer metrics, a solid starting point is the JVM (Micrometer) dashboard (ID 4701) or the SpringBoot APM Dashboard (ID 12900).
To import it: go to Dashboards → Import, enter ID 4701 or 12900, and select the Prometheus datasource.
Browse the full library at grafana.com/grafana/dashboards.
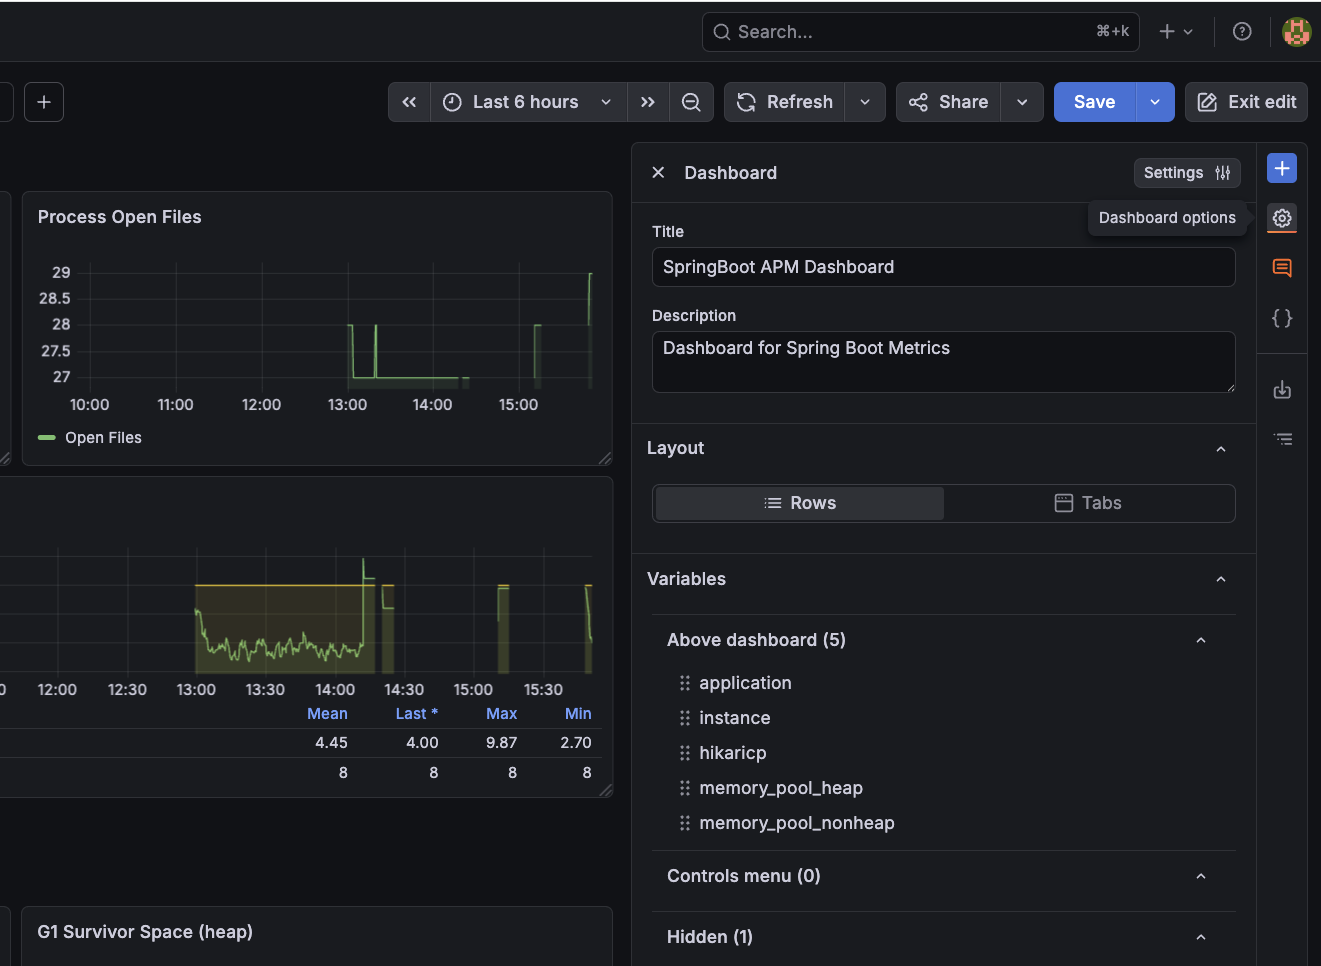
For these dashboards to work correctly, ensure you select the Prometheus datasource that was provisioned for the DS_PROMETHEUS variable. To set this variable, go to Dashboard -> Edit -> Dashboard Options:
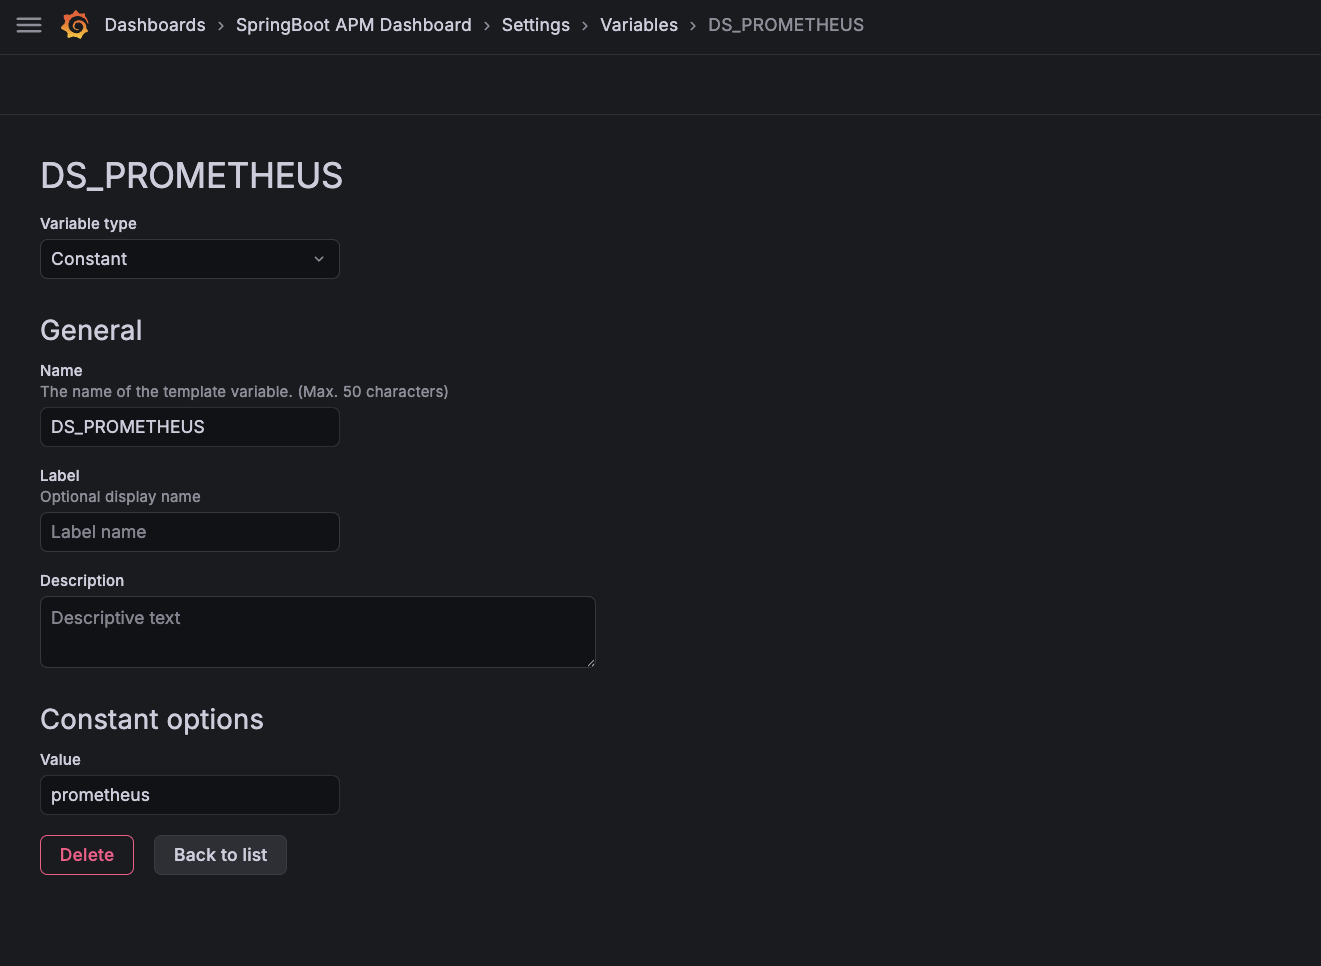
Click on Settings and go to Variables Tab. Create a new constant variable named DS_PROMETHEUS, set its type to Constant, and its value to prometheus (the name defined uid in datasources.yml):
Save the dashboard and you should see all metrics start populating immediately. Explore the various panels to monitor request rates, JVM memory usage, response latencies, and error rates across the entire platform in real time.